Using Propel 1.4 detailed logging
 Fabian Lange
Today Propel 1.4 was released and it contains some debugging goodies.
We can use the DebugPDO class to get the nifty logging into the Web Debug Panel. However some more interesting information is turned off by default by Propel.
It includes:
- Time logging
- Time spent for executing this query
- Memory logging
- Peak Usage during execution of the query
- Total Memory usage after the query ran
- Memory Delta caused by executing the query
- Slow query logging
- Duration after which a query is considered slow
Using this is very easy as of today / symfony 1.3 beta 2:
dev:
  propel:
    param:
      classname: DebugPDO
      debug:
        realmemoryusage: true
        details:
          time:
            enabled: true
          slow:
            enabled: true
            threshold: 0.001
          memdelta:
            enabled: true
          mempeak:
            enabled: true
          method:
            enabled: true
          mem:
            enabled: true
          querycount:
            enabled: true
The whole list can be found in the Propel Documentation. The prefix debugpdo.logging is taken care of by the key debug. Simply put the remaining path below it, creating a new nesting level each dot.
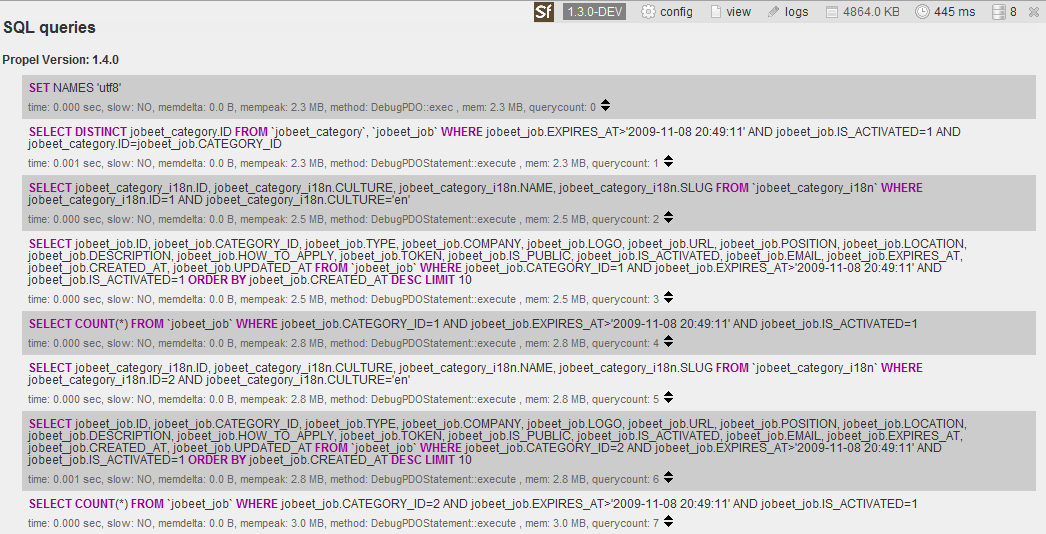
Because Propel takes the order into account, the above configuration results into something like this:
Help the Symfony project!
As with any Open-Source project, contributing code or documentation is the most common way to help, but we also have a wide range of sponsoring opportunities.
Comments
Comments are closed.
To ensure that comments stay relevant, they are closed for old posts.
AWESOME! :)
P.s. with symfony 1.2 + doctrine 1.1 there are just queries, even without execution time ..
I think Propel is a very good ORM.
Can we still use it for new project?