In this series of articles I would like to present you FireSymfony, a Firefox add-on for debugging symfony applications inside the popular Firebug. In this first article I would like to present the add-on and explain how to use it. In the next article I will show how to install and setup FireSymfony.
Some Background
FireSymfony saw the light of day on october last year. One motivation to do it was to integrate two of my favorites web debugging tools, Firebug and the symfony web debug toolbar (SWDT). Also with some fellow developers we were trying to address a problem caused by the SWDT in some of our projects, where the HTML injected by the SWDT was not compatible with our design, making the site looks "broken".
I started hacking some code by reading some tutorials on how to create a Firebug plugin among other resources on the web. After I saw the first protoype working I got really exited about the project, so I decided to develop it further. Soon after the release, The NetCircle, company where I work, decided to support the extension, providing hosting, a domain name and the logo designed by Olaf Horstmann who was at a design internship at the company. Also J. Wan a fellow designer joined the FireSymfony team. We worked together developing the new version, with a focus on improving usability and the presentation of information. The result of this is FireSymfony 1.1.x version.
Near one year later, thanks to the symfony community and support, the extension broke the 6000+ downloads mark and counts 500+ active daily users (According to the Mozilla Add-ons website stats). Adding to that, last saturday it became a Mozilla certified add-on, meaning that users don't have to register to download the extension and they will be notified of extension updates.
Now that you have a brief introduction off the extension let's see how to use it.
Usage
Provided that you successfully installed the symfony plugin and the Firefox add-on you should have a new tab inside Firebug called symfony. If you browse your site under dev environment you can click on the symfony tab to see the debug information that formerly would've been on the SWDT.
The information will be divided into these panels:
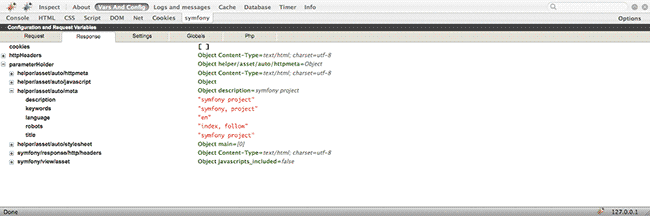
Vars and Config
Here we can inspect our configuration setup and the default PHP variables that are accessible by our application. Some of the information will be:
- Request variables
- Response information, like cookies, HTTP headers, included CSS stylesheets, HTTP metas, etc.
- Session User information.
- Settings, mostly what's inside the app.yml file and the current module.yml file. Here you can see how the configuration cascade acted upon the set up.
- Globals, like $_GET, $_POST, $_ENV, etc.
- A list of installed PHP extensions.
- Symfony information, i.e.: version and installation PATH.
You can browse through this information in the same fashion you do it while inspecting objects in Firebug.
Logs and Messages
Under this panel we can inspect all the symfony logs. They can be filter by type and category. As an upcoming feature we want to provide the ability to filter the logs by keywords entered by the developer.
Cache
This panel shows information regarding the cached components on the page. The special feature here is that you can roll over the information items on the toolbar to see the highlighted HTML on the page. This feature works in the same way as the Firebug inspector does.
Database
The database tab displays the queries executed for the current action if any. You can click over a query to copy it to the clipboard making it easy to go and paste it on your SQL client to debug/explain the query.
Timer
The timer tab displays the amount symfony spent during the difference parts that compose the processing of a request and the final rendering to the user. The main difference with the SWDT is that here you can see a nice colored graph according to the time percentage for each section. Keep in mind that with symfony you can add new timers in order to gather more information about your application timing.
Info
This tab displays the framework version, the memory usage for the current action execution and some configuration details related to your server, i.e.: is xdebug enabled? is cache enabled? and so on.
Future
Those are the features implemented so far. We plan to continue improving the usability of the Firebug plugin and also adding new features for better browsing through the logs. Stay tuned and in the upcoming blog post we will see how to install and setup the extension.
isn't it a bit stupid you first show how to use it and then how to install it? Or at least a quick link... Of course, the really "smart" of us can google it, but that's not my point...
The useful link: http://www.firesymfony.org/ ;)
It`s not working with my project (1.2.7).
Great tool. Thanks!
I am using Symfony 1.2.8 and I cannot get any of the sections to show any data apart from the header (e.g. database etc)
Gran trabajo!!! felicitaciones!!!
it do not work for me. The javascript variable FireSymfonyDebugData exists and there are also some content, FireSymfonyDebugData = {"cache":{"title":"reload and ignore cache","content":{"reload_url":"","cache_info":[]}},"config":{"title":"Configuration and request variables","content":{"request":{"parameterHolder":{"action":"index","module":"
But the content in the firesymfony addon are empty.
symfony 1.2.8 firesymfony addon 1.1.1 firesymfony plugin 1.1.1
Hi all, thanks for your comments and interest. Please report your issues at the google code project site: http://code.google.com/p/firesymfony/issues/ so I can keep track of them.
one more tools to become Symfony addict. Thanks
It worked fine for me thanks!
WoooW! this is great, good job fellows!!!!
Could be cool if it would support the new sf 1.3 db bar stuff ;)
Doesn't seem to work (sf 1.2.8) :(
Hi, i would like to read next article that explains how to install and setup FireSymfony.
For those having trouble with the installation, this links may be helpful:
In addition to the Firefox extensions and Symfony plugin, there's some YML fiddling to do as well so that the plugin's class is used instead of the basic SWDT class.
Question for Alvaro: I was using this in conjunction with caching, and found that my cached partials/components still get embedded debug styles (black border, and overlaid box in the top corner with an "X" button). With SWDT, I could click its "sf" icon and all in-line cache styles would disappear in tandem with the SWDT collapsing down to a square icon. With your plugin, the cache styles still show up, but since there's no toolbar on the page I can't find a way to turn them off. Is this outside the scope of your plugin? I considered the possibly the SWDT and caching classes were coupled in a way that SWDT knew to interact with the caching debug CSS, despite not being the source of their markup.
@Jeremy Mikola I know what you mean about the caching part. With symfony 1.0 this was easy to remove, but symfony 1.2 uses the event system to decorate the view with the cache information , and is using the event system via the filter call, so I can't remove what symfony adds by itself... Maybe I can propose a patch, like checking that the class of the debug toolbar inside factories.yml is the symfony one, if not, then the filter shouldn't do anything on symfony side, but delegate the action to the debug toolbar implementer.
To the other users, the installation instructions should be on their way. Thanks for your patience.