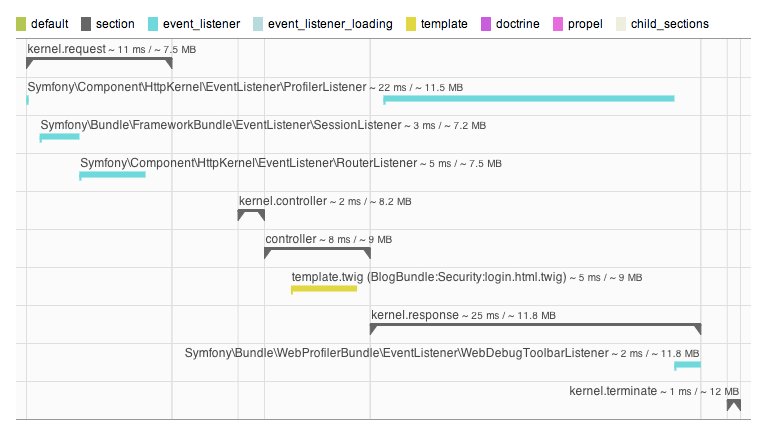
Symfony 2.2 gave birth to two new components: PropertyAccess and Stopwatch. Like PropertyAccess, the Stopwatch component was not written from scratch, but it was extracted from code that was previously hosted in the HttpKernel component. But as the code can be useful by itself, we decided to extract it and make it standalone.
So, what is it about? As you might have guessed now, the Stopwatch component provides a way to measure the execution time of specific parts of your code. In Symfony, it is heavily used by the profiler to gather information about what happens during the handling of request and how much time is spent in each layer.

I won't explain how it works here as the documentation has been already written for it in the official documentation.
But let me give you one useful tip: if you want to include your timing information directly into the Symfony profiler timeline panel, just use the Stopwatch instance that is available via the service container:
1
2
3
if ($this->has('debug.stopwatch')) {
    $stopwatch = $this->get('debug.stopwatch');
}
The check for existence is required as this service is only available in the debug environment.
Happy debugging!
Is it possible to add extra information into the stopwatch? i.e. I use DynamoDB and I'd like to be able to add in the round trip query time.
where is the memory information coming from?
Ha nice one. This is really useful for long running background scripts log too.