Symfony displays a nice screen whenever a problem occurs in your code like when an exception is thrown or a PHP warning is triggered. This eases the debugging of problems as the screen gives you the issue, the location of the error, and the full stack trace. And if you setup the ide option, you can even click on any file to open it in your regular IDE or text editor at the right line. That's really nice.
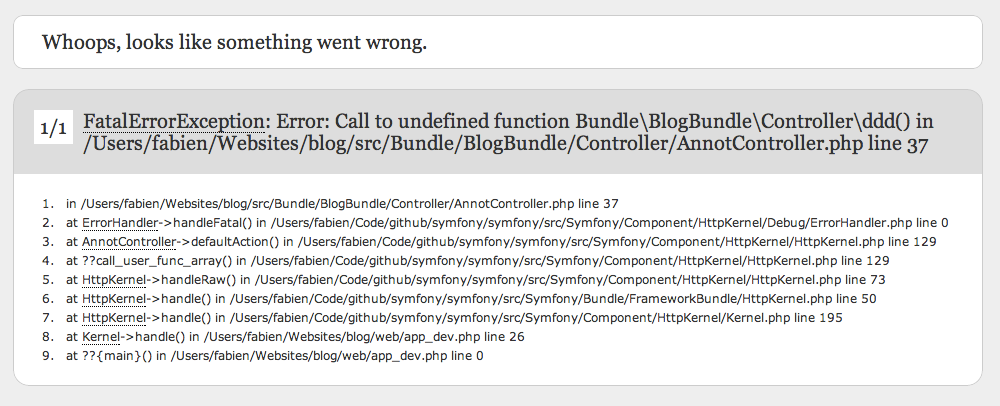
But as of Symfony 2.2, this feature is even nicer as fatal errors are also nicely displayed in your browser like any other errors.
Here is how a fatal error is displayed in Symfony 2.0 and 2.1:

And here is the same fatal error displayed from a Symfony 2.2 application:

Far better indeed. ;)
Great addition!
Hi, and this is what exception, fatal error, or regular error looks like with Nette Framework Debugger http://goo.gl/83pCq
http://hosiplan.com/nette/exception.html
superb i did not know you could open the error on your favorite ide, going to try that now with phpstorm, i hope it does not open an instance with every click or is not too heavy
good job
NICE ONE!
Nice!
I've plans add possibility log this types of errors and send emails about it. If you have suggestions how to do this - please describe they here https://github.com/symfony/symfony/issues/2042 .
Really nice!
Really, really nice!
Excellent!
Great job!
Nice one! This should save development time!
Great!
Awesome!!
Nice one ;-)
Found some instructions how one could configure protocol to open favourite IDE: http://pla.nette.org/en/how-open-files-in-ide-from-debugger