The web debug toolbar and the profiler are two of the most used features of Symfony. They provide detailed debug information about the execution of the page you are looking at. In Symfony 3.1 we decided to improve them to display the information about forwards and redirects.
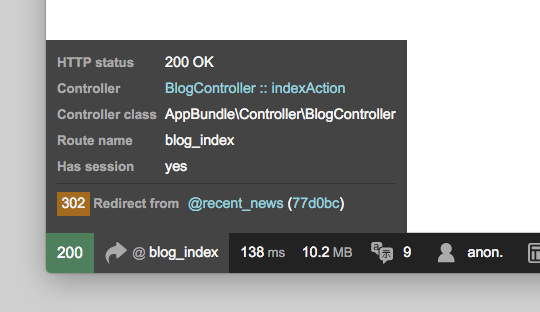
First, when a controller is redirected from another controller, you'll see a curved arrow icon next to the route name to let you know that a redirect happened in the background:

Reveal the panel information and you'll see the details of the redirect: HTTP status code, the original route that made the redirection and a link to the profiler of the original request:

If the method of the redirection is different from GET, you'll see that too
in the toolbar:

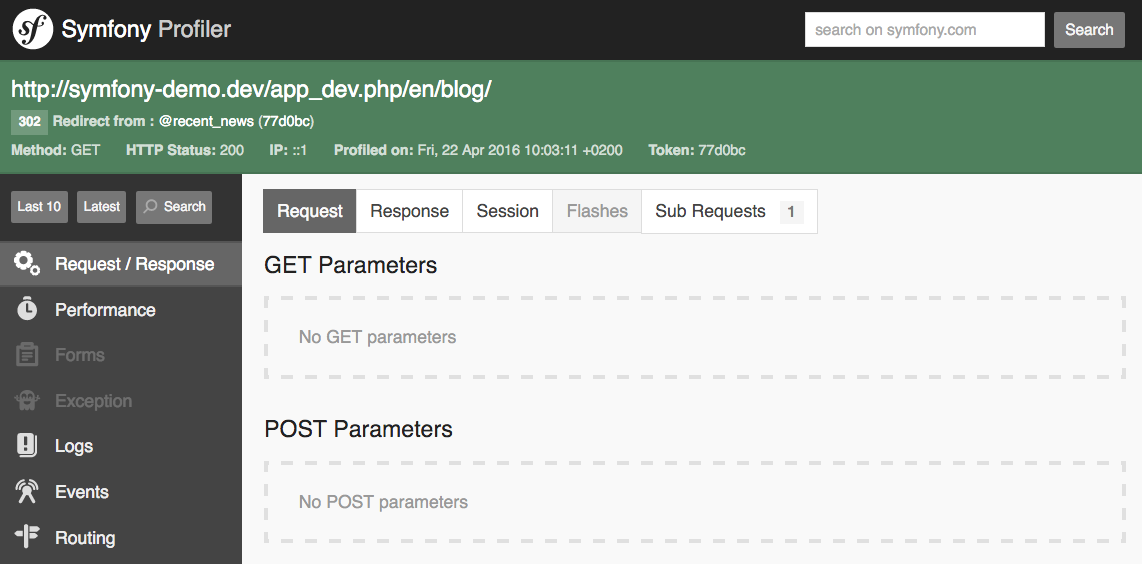
The redirection information is also displayed by the Symfony Profiler in the status section, including a link to the profile of the original request:

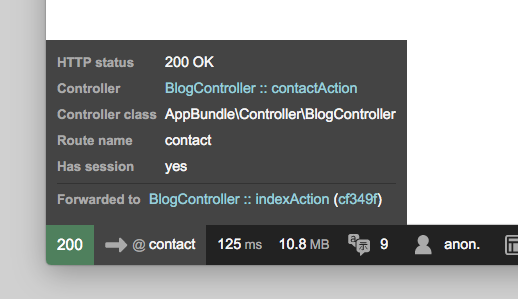
Redirecting requests is pretty common in Symfony applications, but if you also forward requests, the toolbar will now display that information too. First, you'll see a straight arrow icon next to the route name indicating the forward:

Once again, reveal the panel information to see all the details about the forward:

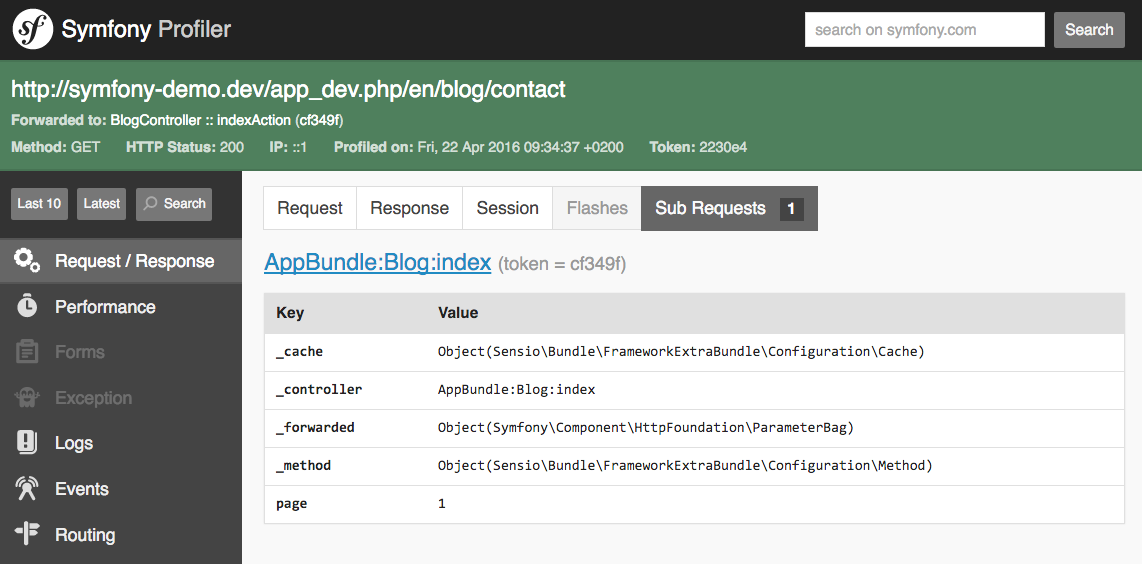
Lastly, this information is also displayed in the Symfony Profiler:

Very nice improvement, so useful ! Need it too in 2.8 :D
Good ! This is way quicker to use than "intercept_redirects: true"
Very good !
I was quite sad to use "intercept_redirects: true" all the time in dev ! :D
Awesome !
Great ! really usefull thanks :)
Nice feature! :)