Made the toolbar compatible with Content Security Policy
The new Content Security Policy HTTP response header helps you reduce XSS risks on modern browsers by declaring what dynamic resources are allowed to load via a HTTP Header.
If your application defines such a policy, the script-src or style-src
directives could disallow unsafe inlines, which would prevent the loading of the
web debug toolbar.
In Symfony 3.2 we made the web debug toolbar compatible with those kind of Content Security Policies. Internally this change required massive code updates, but for developers it will be completely transparent and it won't require any change in their applications.
Used VarDumper in the profiler
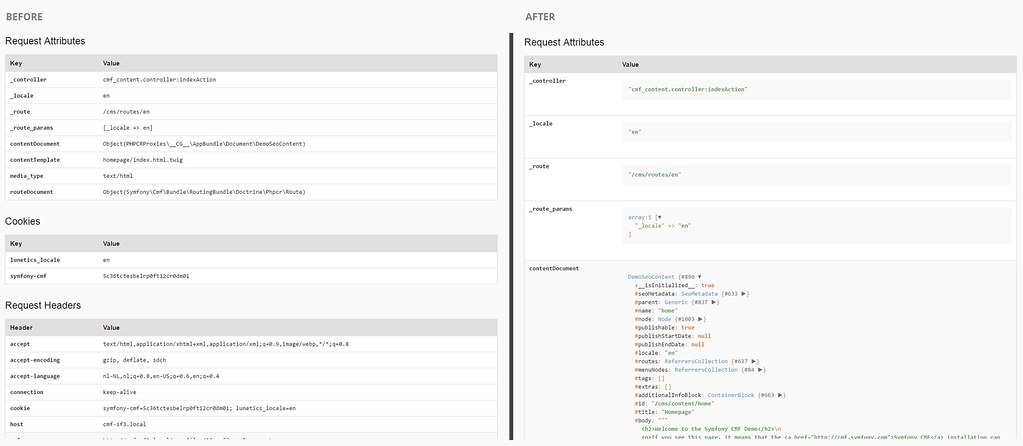
The Symfony profiler displays the contents of lots of variables. The dumping of those contents is made in the profiler itself and is challenging for variables that are complex arrays or objects.
In Symfony 3.2 we decided to use the VarDumper component to dump the contents of all variables. This will make the information easier to understand thanks to the new syntax highlighting and the toggles to reveal/collapse long contents:

Added support for window.fetch calls
The Fetch JavaScript API provides an interface for fetching resources in a similar fashion to XMLHttpRequest/Ajax. However, the new API provides a more powerful and flexible feature set and that's why lots of developers are replacing Ajax with it.
The web debug toolbar includes a panel with the profiles of the requests made via Ajax. In Symfony 3.2, this panel will also display the requests made with the new fetch API.
Easier to debug form errors
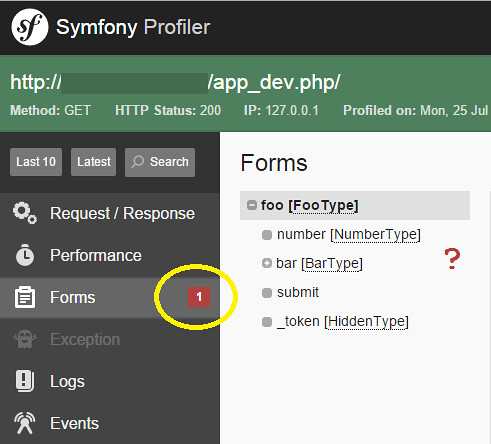
When an error occurs in a Symfony form, the profiler shows the number of errors but you must navigate through the form fields to find the actual field causing the error:

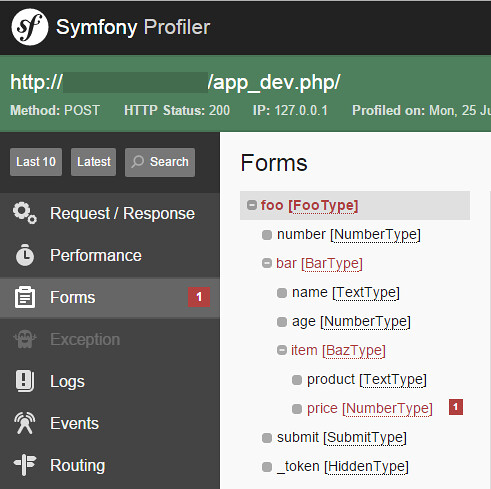
In Symfony 3.2 we changed the behavior of the Form panel in the profiler to always expand automatically the form fields that caused any error:

It always is great to have new features added to the toolbar/profiler that make the tough developer life easier :-)
Hmm.. The new VarDumper output in the profiler looks like it requires much more space, making "one liners" much less clear (Bigger tables / less overview)
This looks better: https://cloud.githubusercontent.com/assets/749025/17652104/98f5de10-6274-11e6-956b-1b02f334763f.png
Great news! Will this CSP support arrive to 2.8 also?
Hello, you can have a look at this add-on for Git : https://github.com/kendrick-k/symfony-debug-toolbar-git
@Károly, no it will not be included at 2.8 previous Symfony version allow only bug fixes and not improvement.
Nice one! :)
Could you please clarify about Content-Security-Policy? Have you added an extra header (Content-Security-Policy) in the develop environment to comply with the rules? Thanks!