The Stopwatch component provides a simple and consistent way to measure
execution time of certain parts of your code. It's more convenient and powerful
than calling to microtime() PHP function continuously.
Even if you haven't used this component directly yet, you use it every day in the Symfony Debug Toolbar and the Symfony Profiler to measure your application performance. In Symfony 3.4 we introduced two new features to make this component more useful.
Added a reset() method
Contributed by
Jose Gonzalez
in #23285.
The new reset() method makes the Stopwatch object to be reset to its original
state, deleting all the data measured so far. This allows the stopwatch to be
reusable, and emulates the reset button of a physical stopwatch.
Added support for microseconds
Contributed by
Javier Eguiluz
in #23223.
Stopwatch component supports time measures of any precision (microseconds,
nanoseconds, etc.), but those measures are converted to integers, losing any
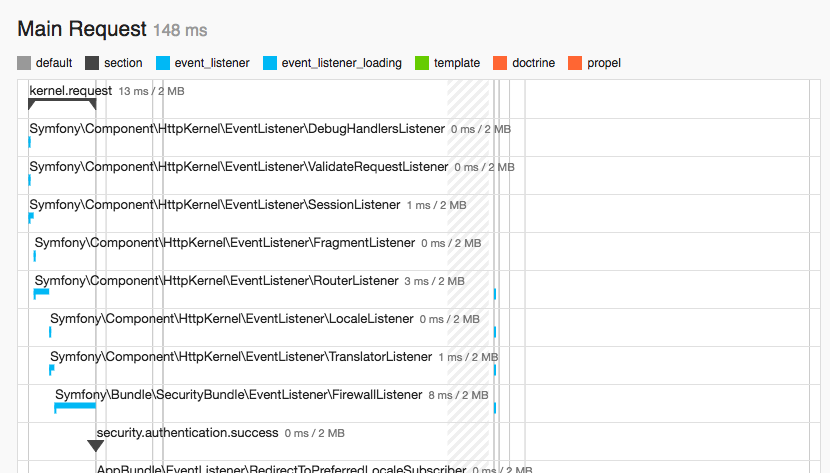
sub-millisecond precision. That's why you usually see some 0 ms measures in
the Symfony Profiler:
In Symfony 3.4, the code of Stopwatch has been updated to stop converting time
measures to integers, so no precision is ever lost. In order to maintain backward
compatibility, this new behavior is disabled by default and you must pass true
to the Stopwatch class constructor to enable it.
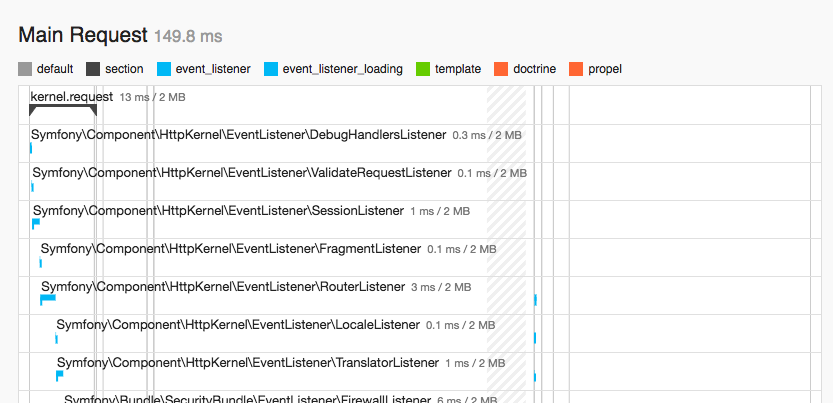
The Symfony Profiler uses this feature by default, so the previous profiling now
looks as follows (0 ms is now 0.1 ms, 0.3 ms, etc.):


Nice !
Nice one!