
The exception page is probably the Symfony feature that you see most often while developing applications. Its design has remained almost unchanged for years, and it showed its age. Symfony 8.2 redesigns the exception page entirely to help you find the cause of an error faster.
New Exception Page Design
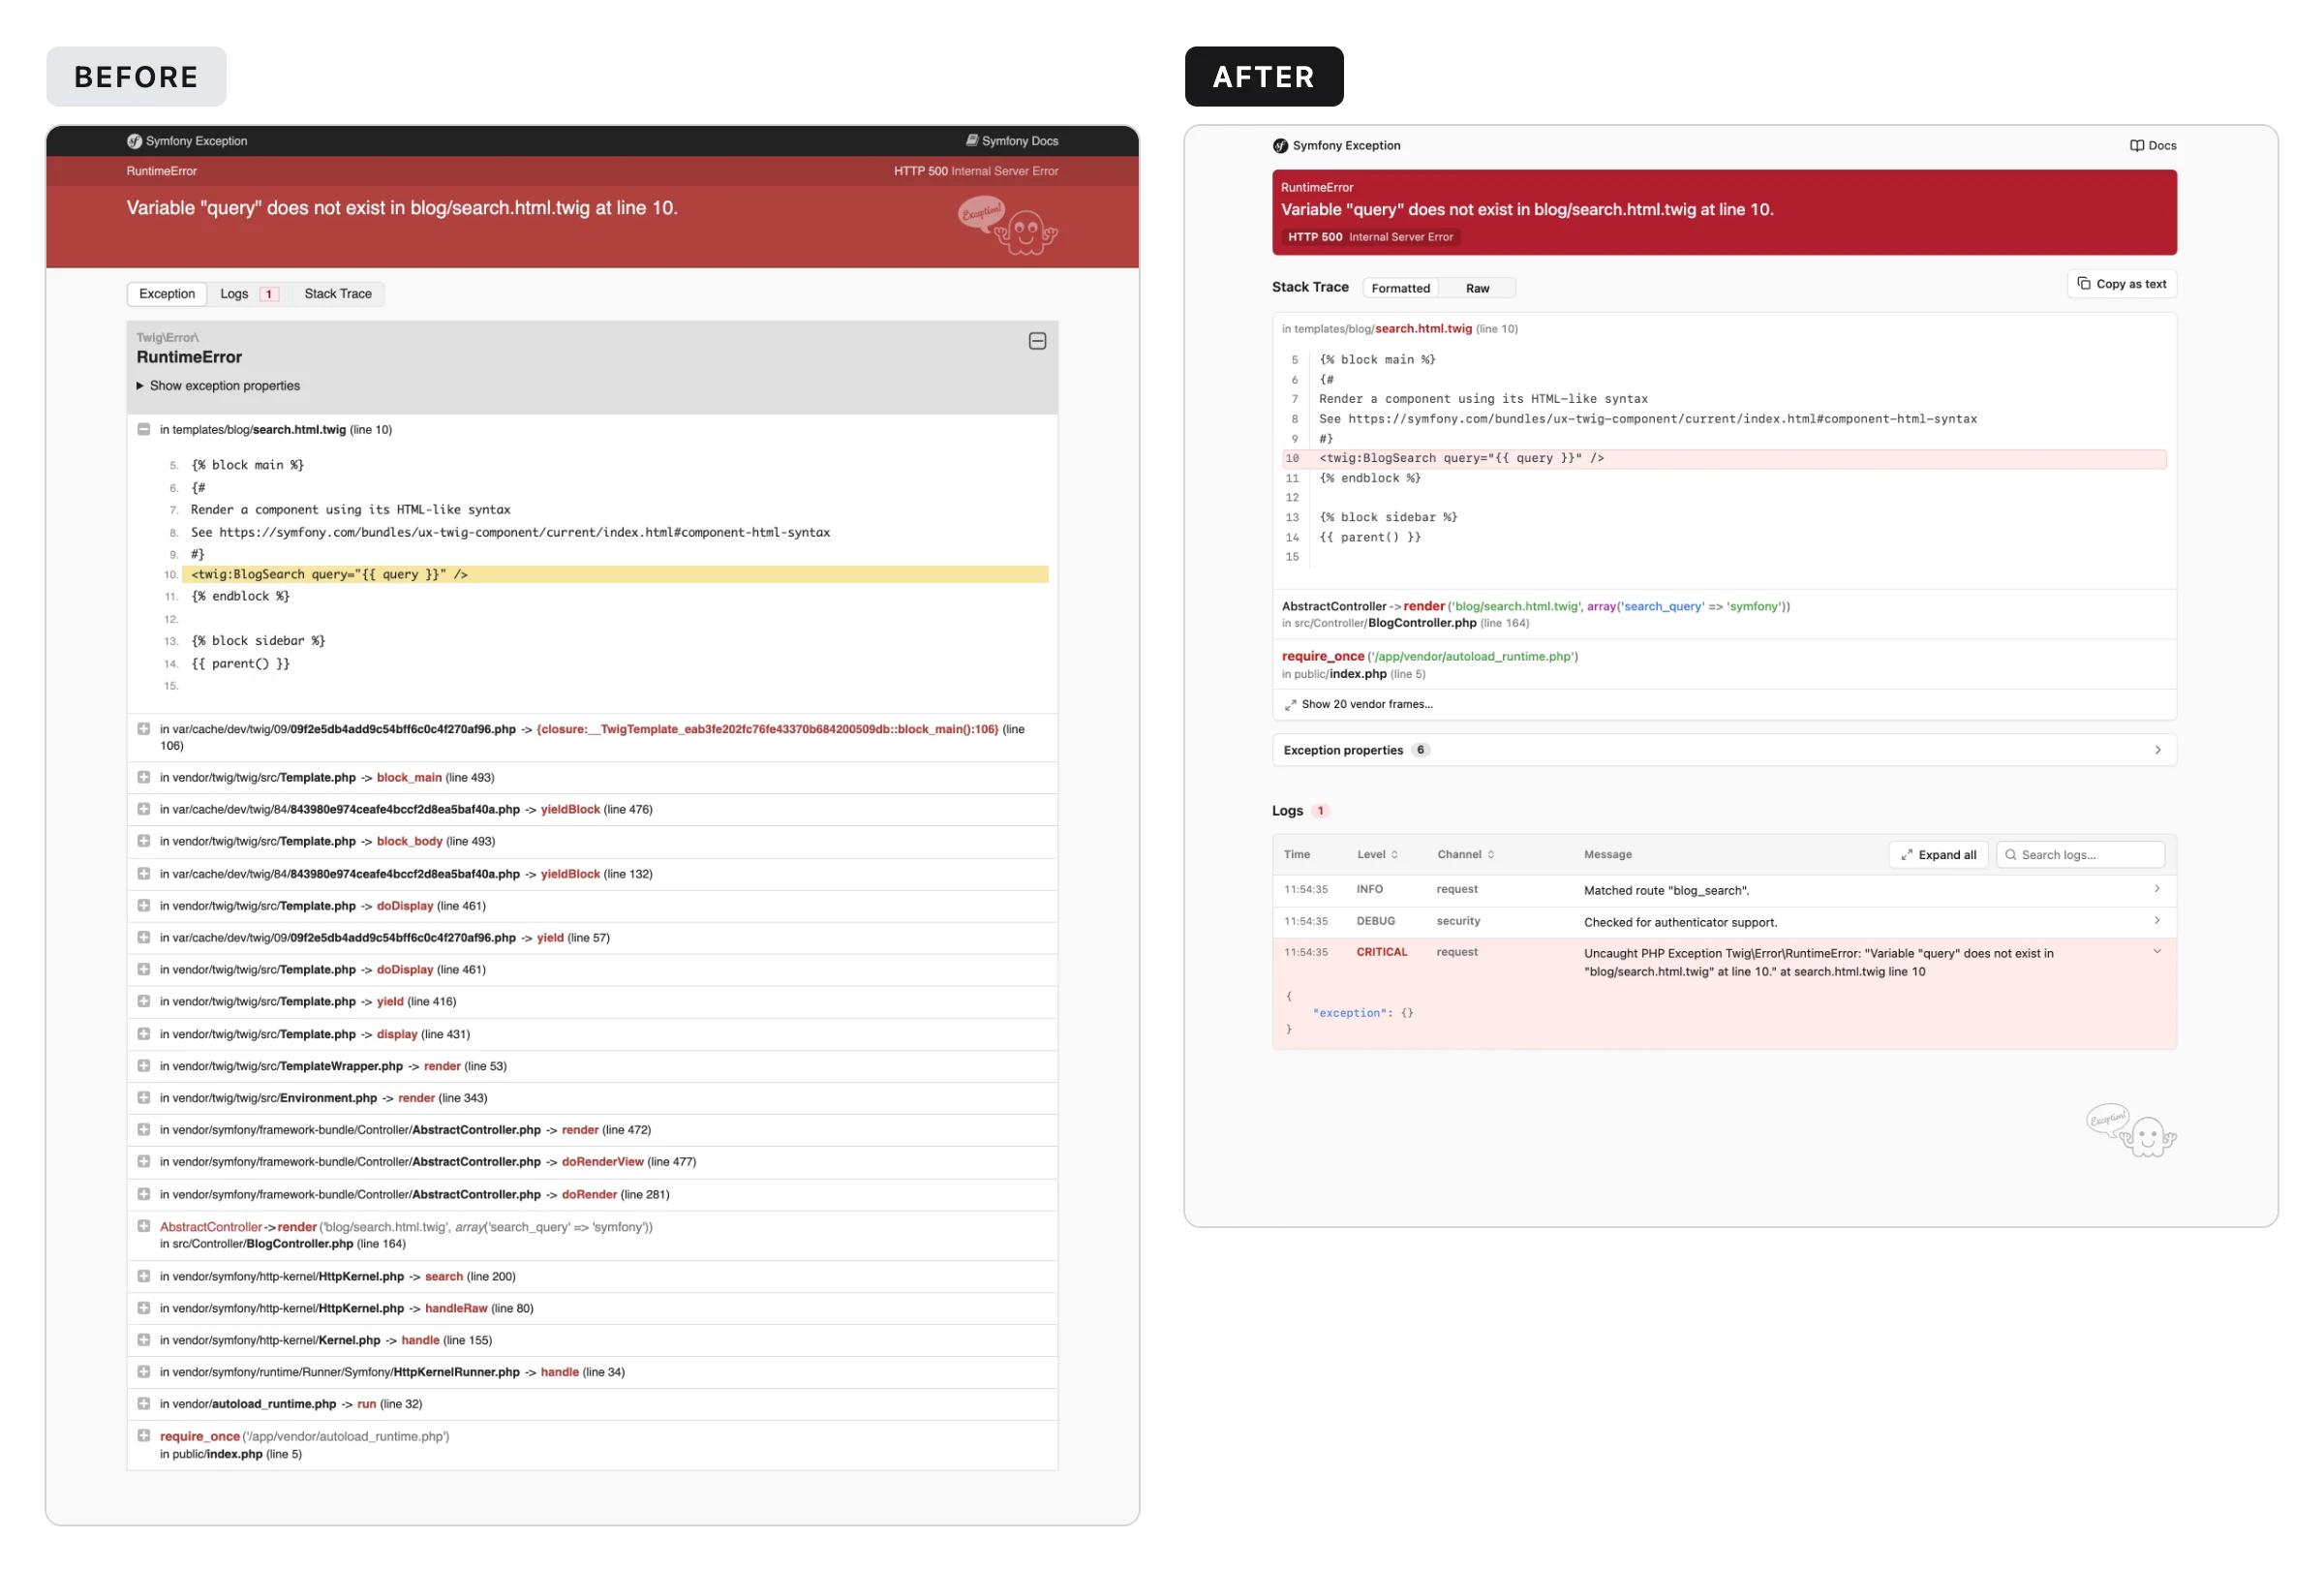
In previous Symfony versions, the exception page was divided into three tabs
(Exception, Logs and Stack Trace) and listed every frame of the
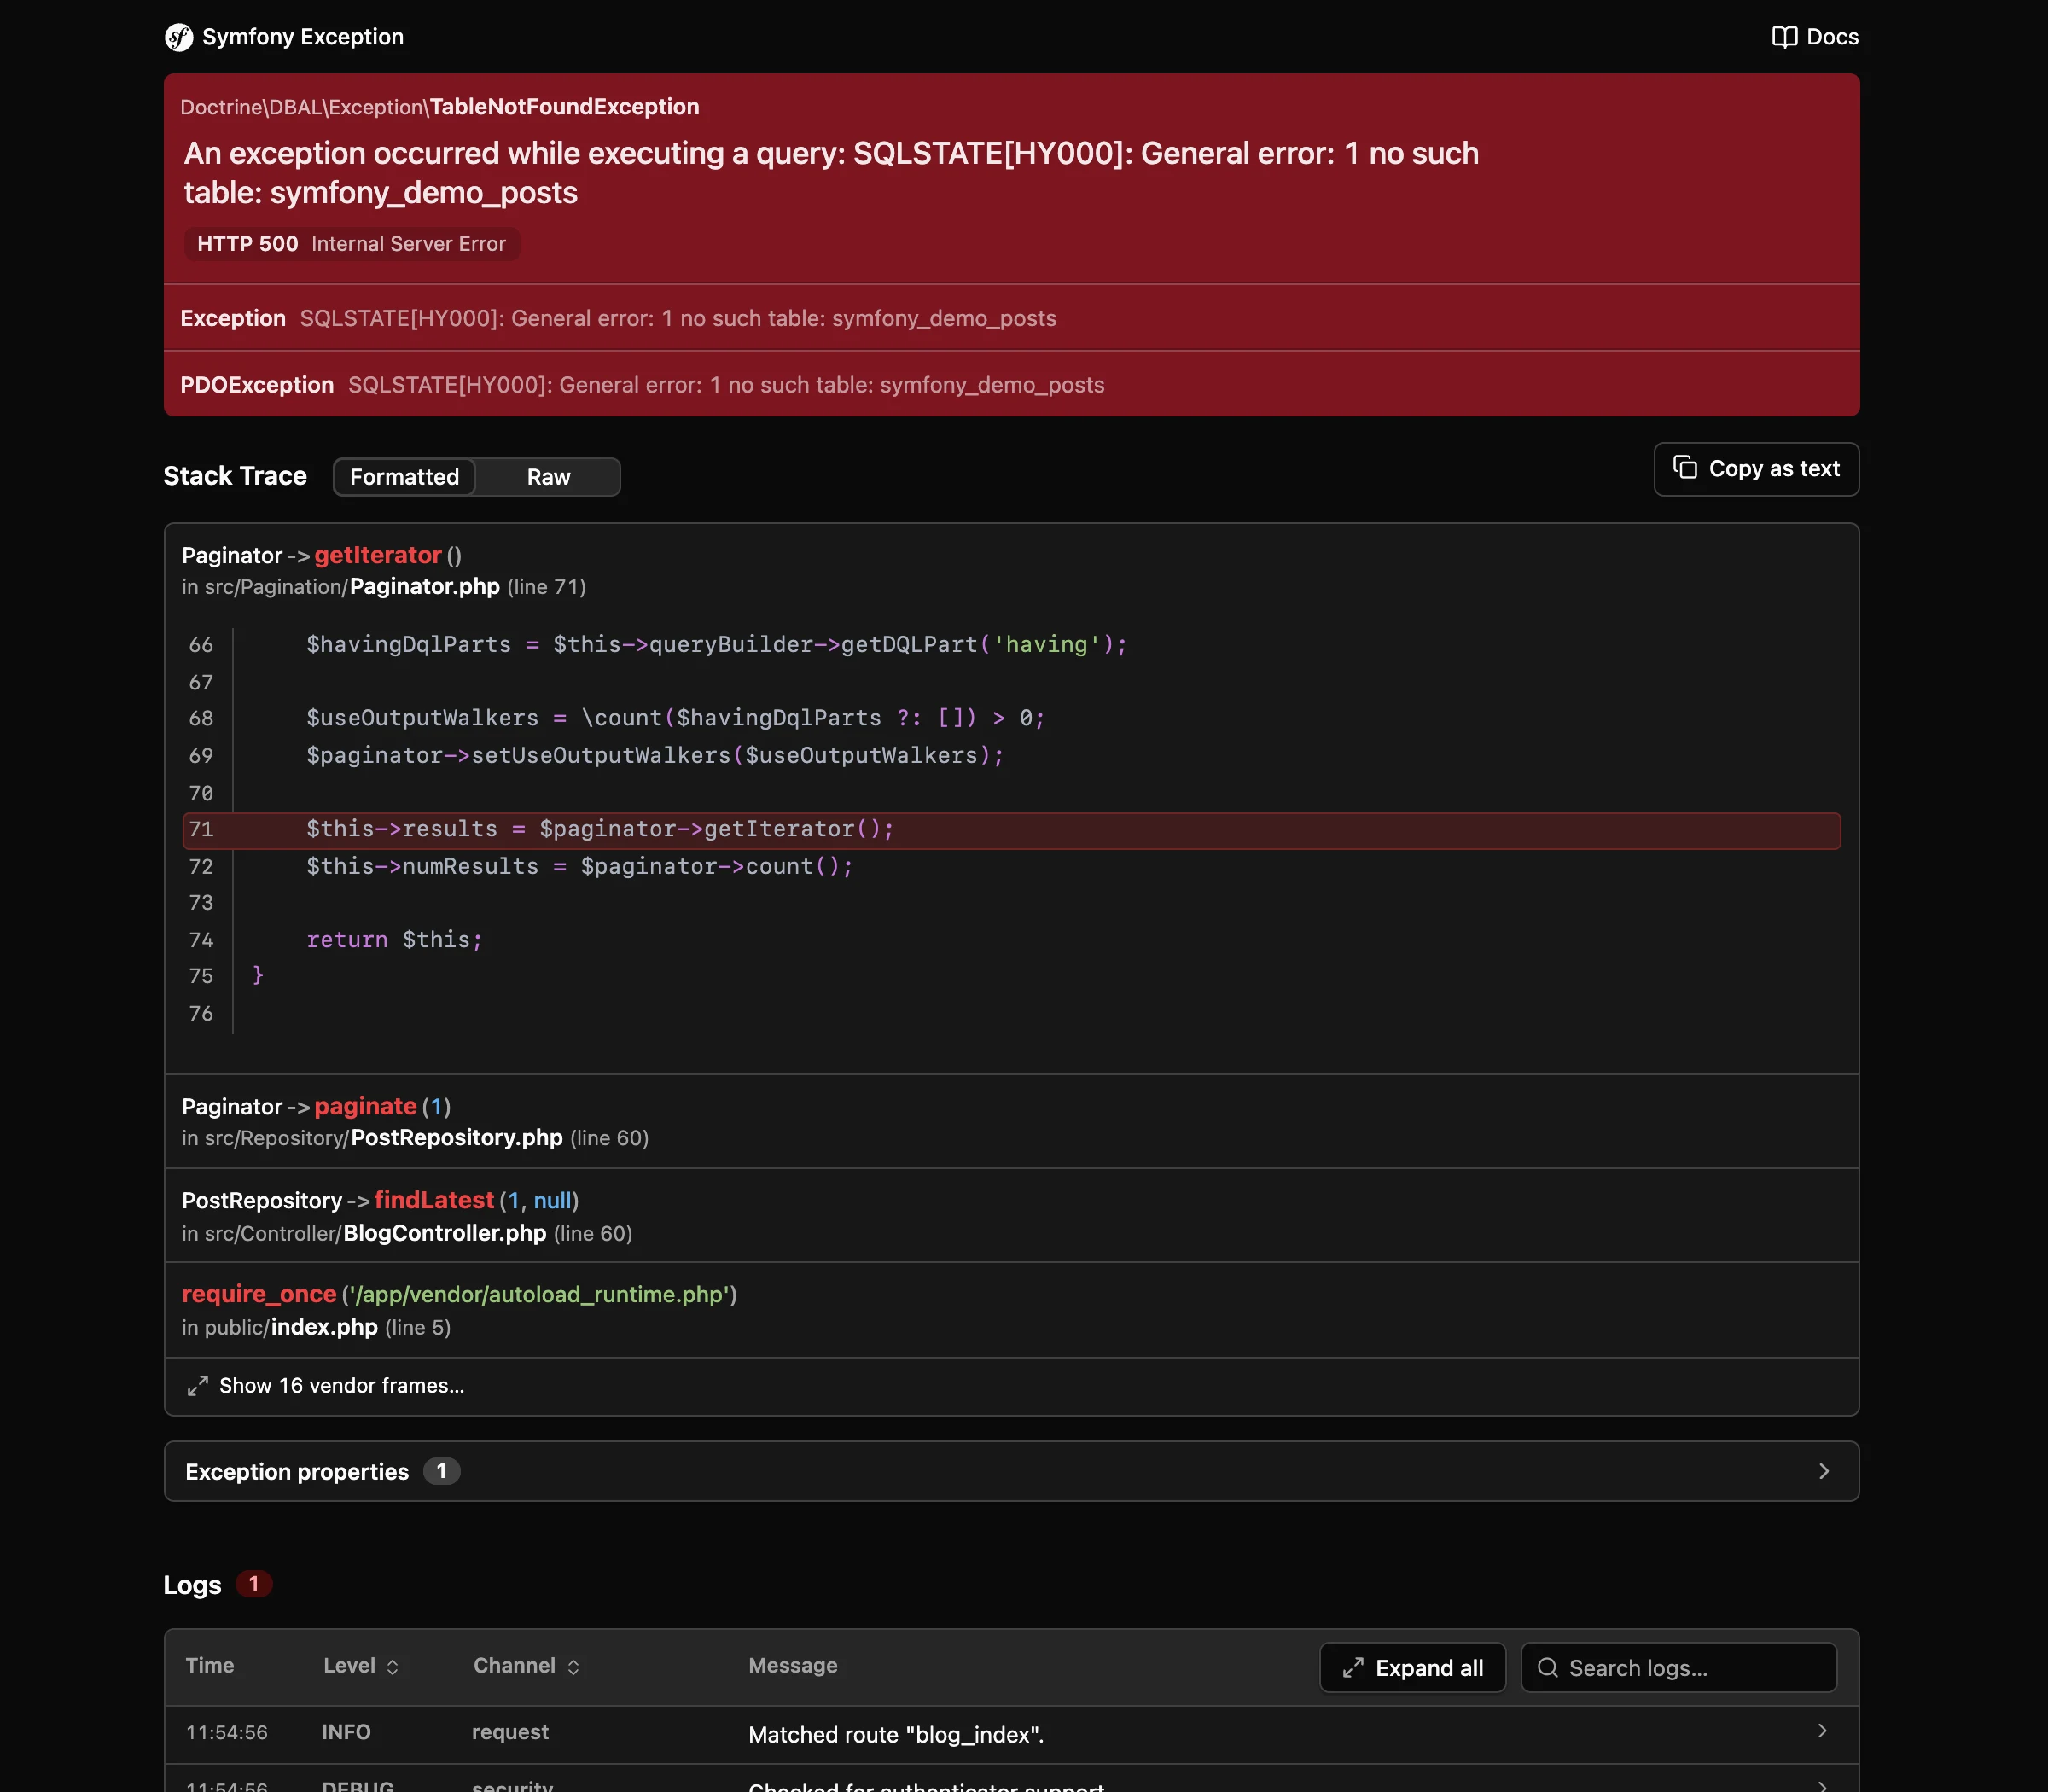
stack trace with the same importance. In Symfony 8.2, the page no longer has
tabs. The exception message, the stack trace and the logs are displayed one
after the other, so the information that you need most of the time is on a
single page:
The same design is used in the exception panel of the Symfony profiler, so errors look and behave the same in both places.
Exception Chains
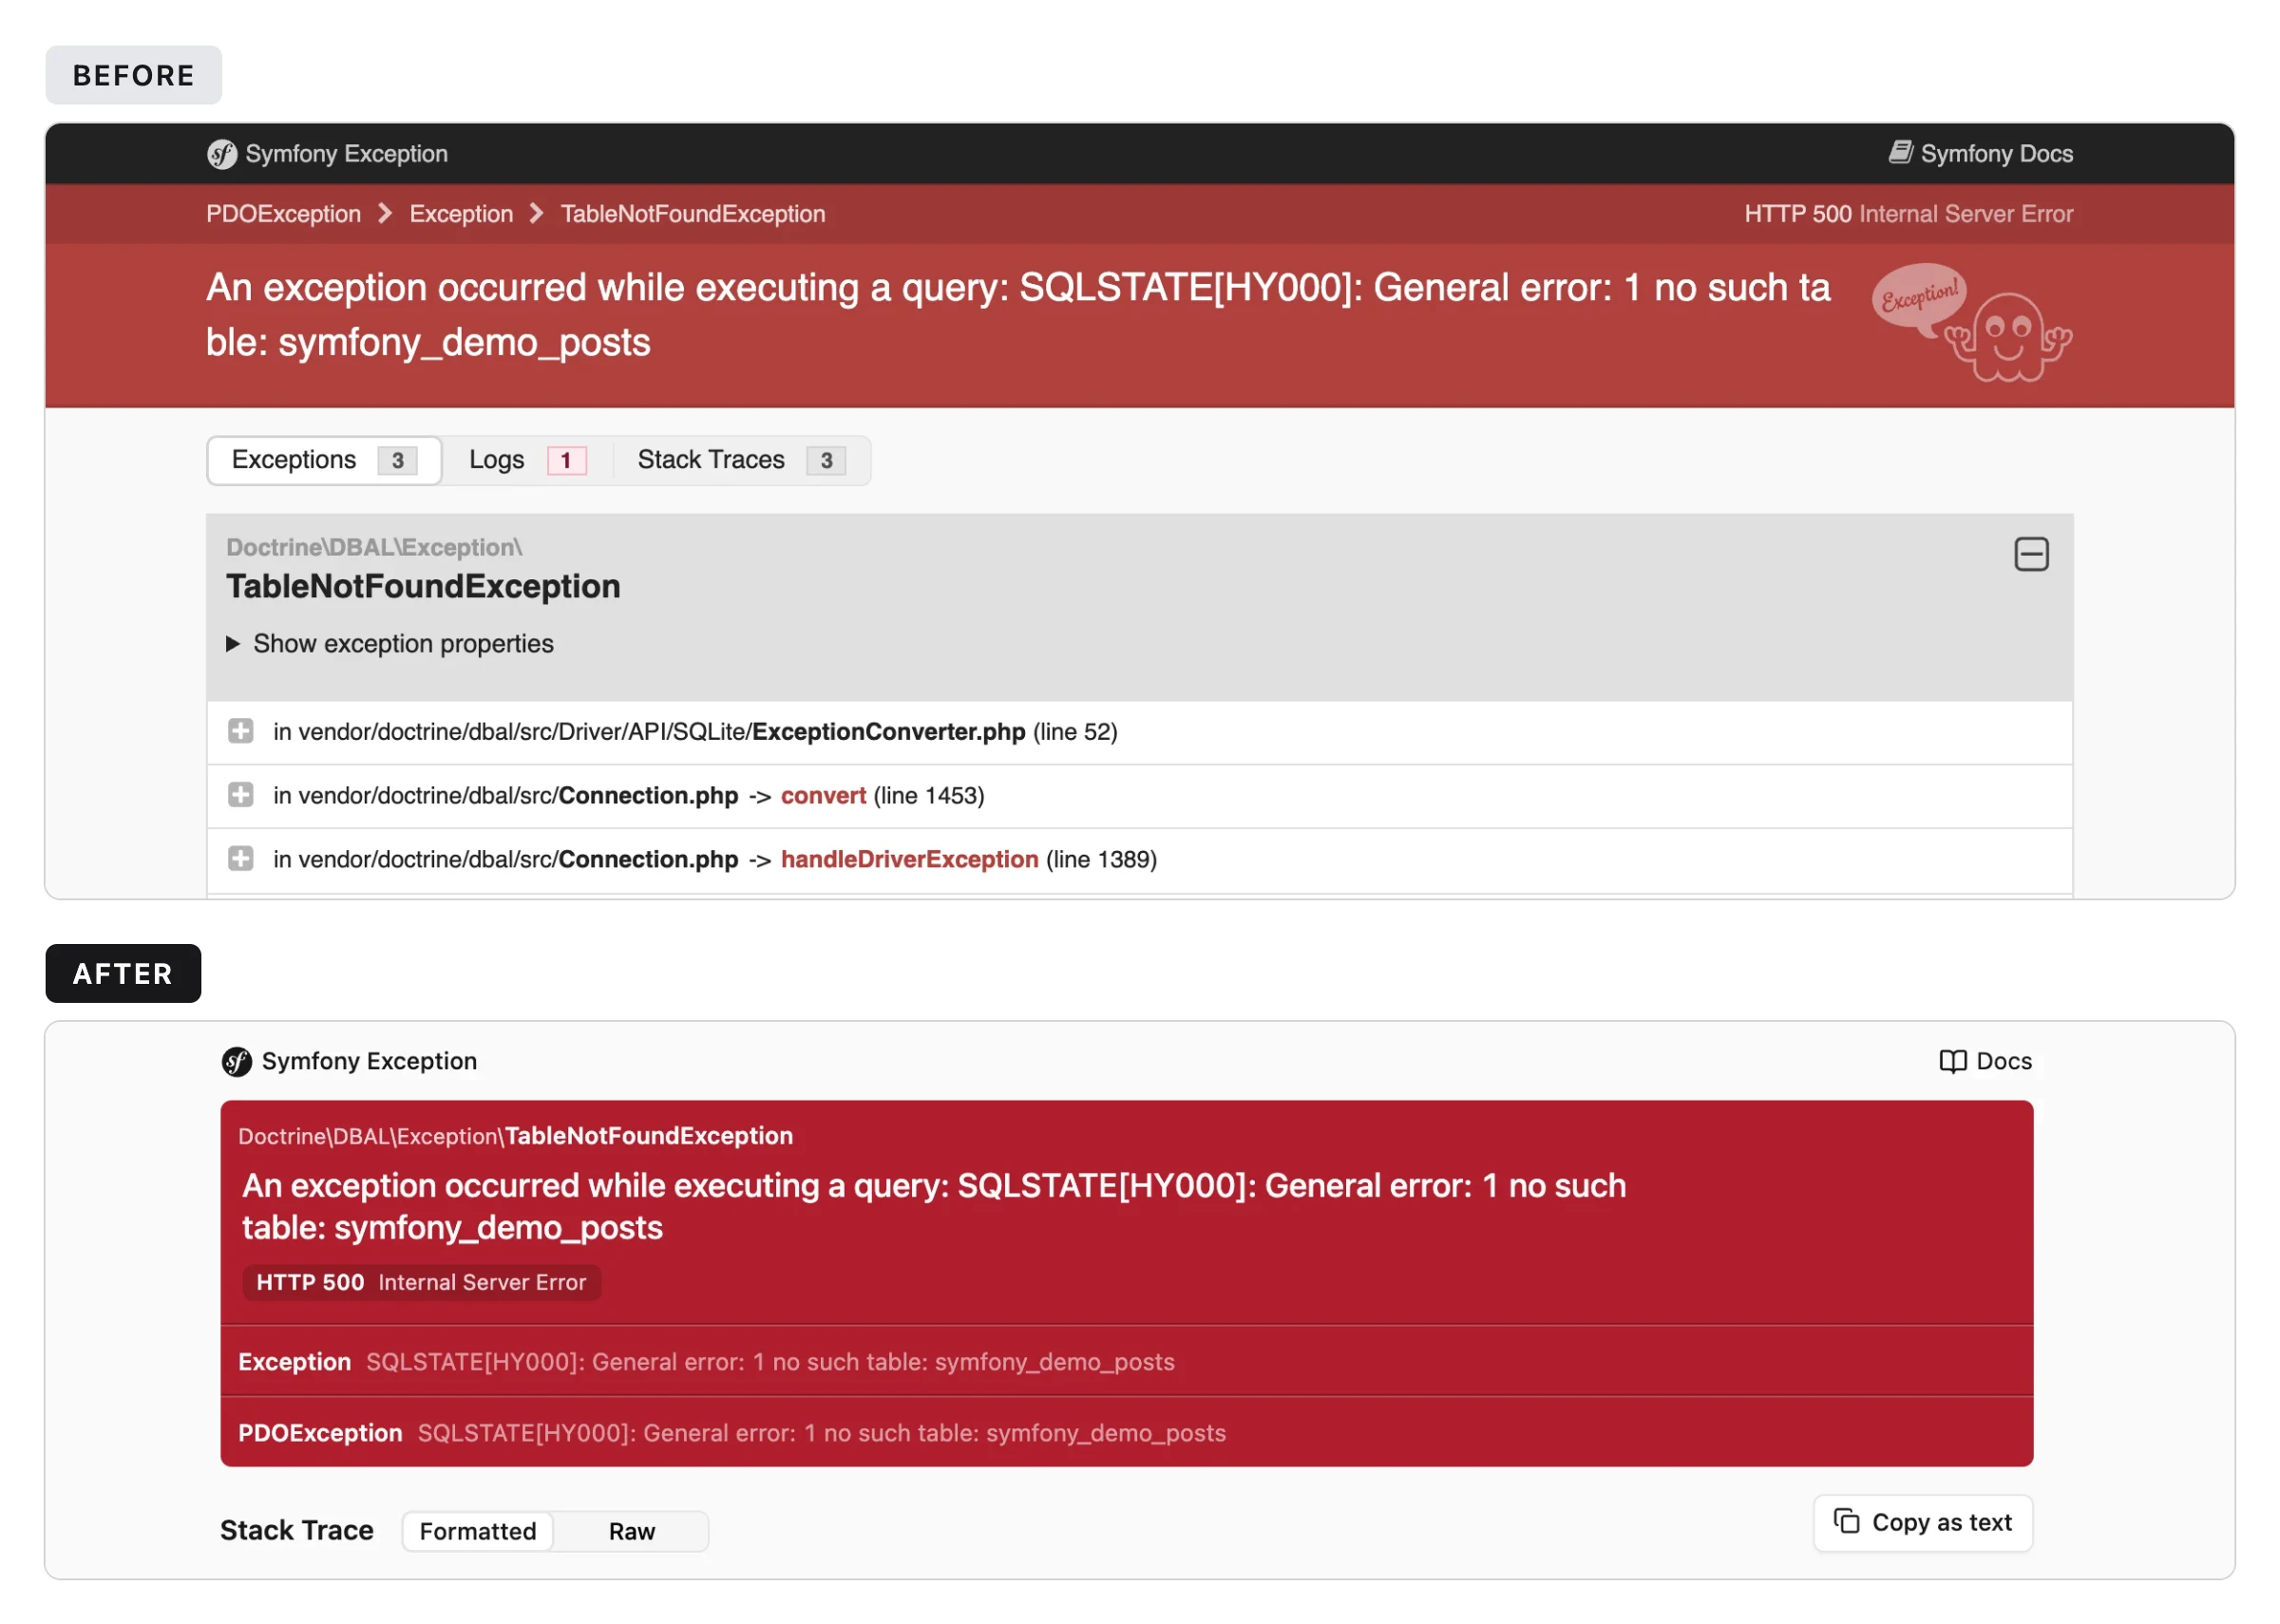
Many errors are a chain of exceptions, where each one wraps the previous one. Before, the chain was displayed as a row of breadcrumbs at the top of the page, and the details of all exceptions were rendered one below the other. The new header lists all the exceptions of the chain, with the most recent one at the top and the root cause at the bottom, and shows the message of each of them:
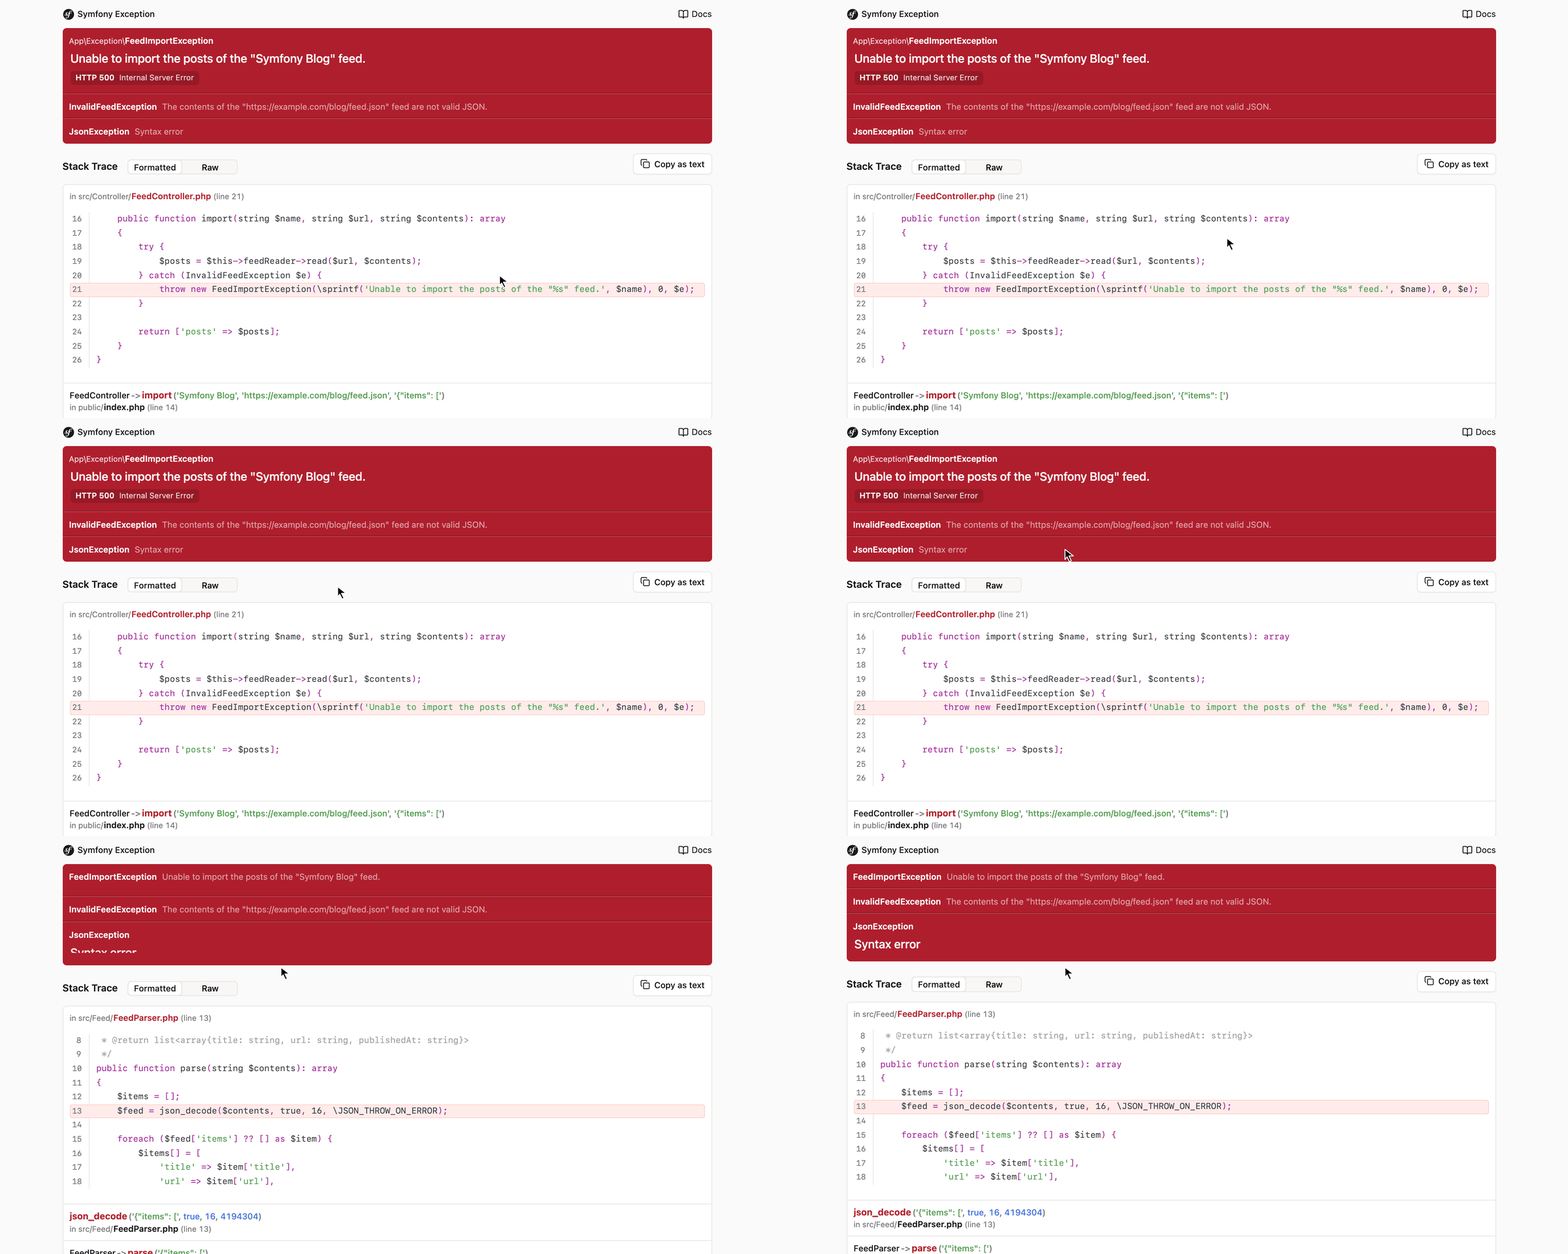
Click on any exception to see its stack trace. The page shows the details of only one exception at a time, which keeps it short even for long chains:
Stack Traces Focused on Your Code
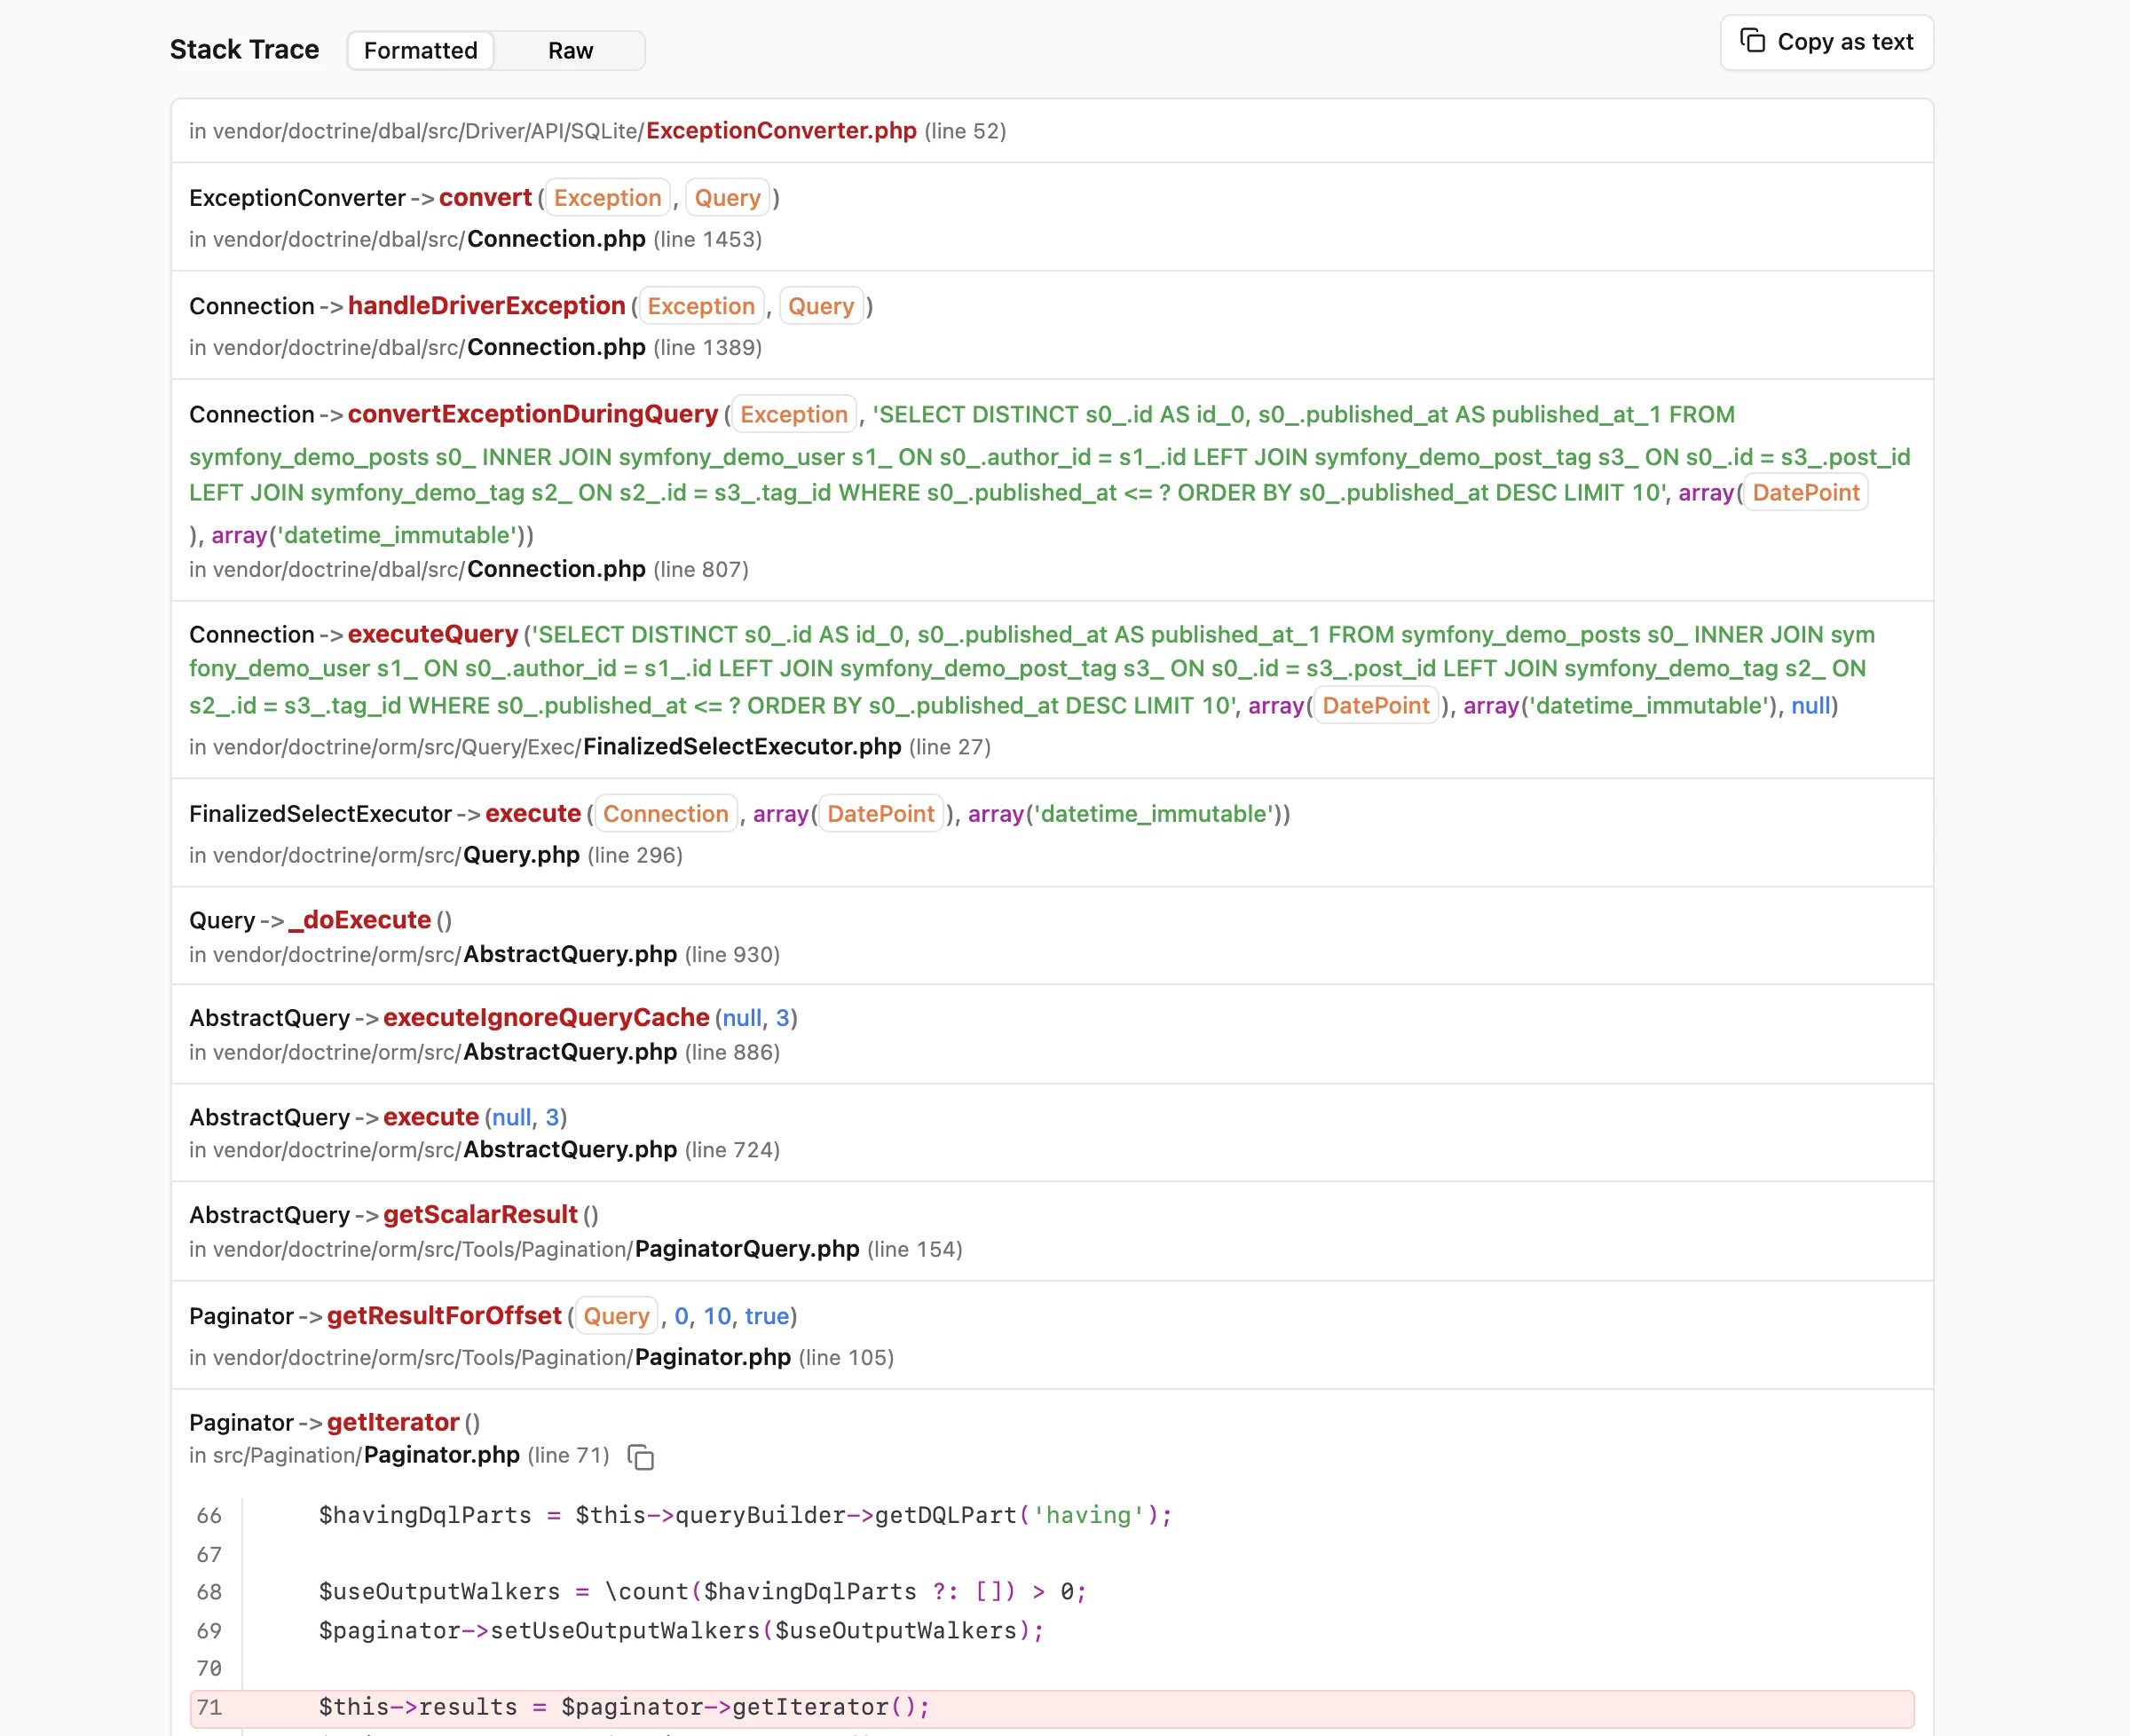
The error is usually in your own code, not in the code of your dependencies. That's why the stack trace now hides the vendor frames by default and shows only the frames of your application. In the first exception of the example above, that reduces the trace from 20 frames to 4.
Click on the "Show 16 vendor frames..." button to display the full trace. All frames show their arguments, with the same syntax highlighting used in code excerpts, logs and exception properties:
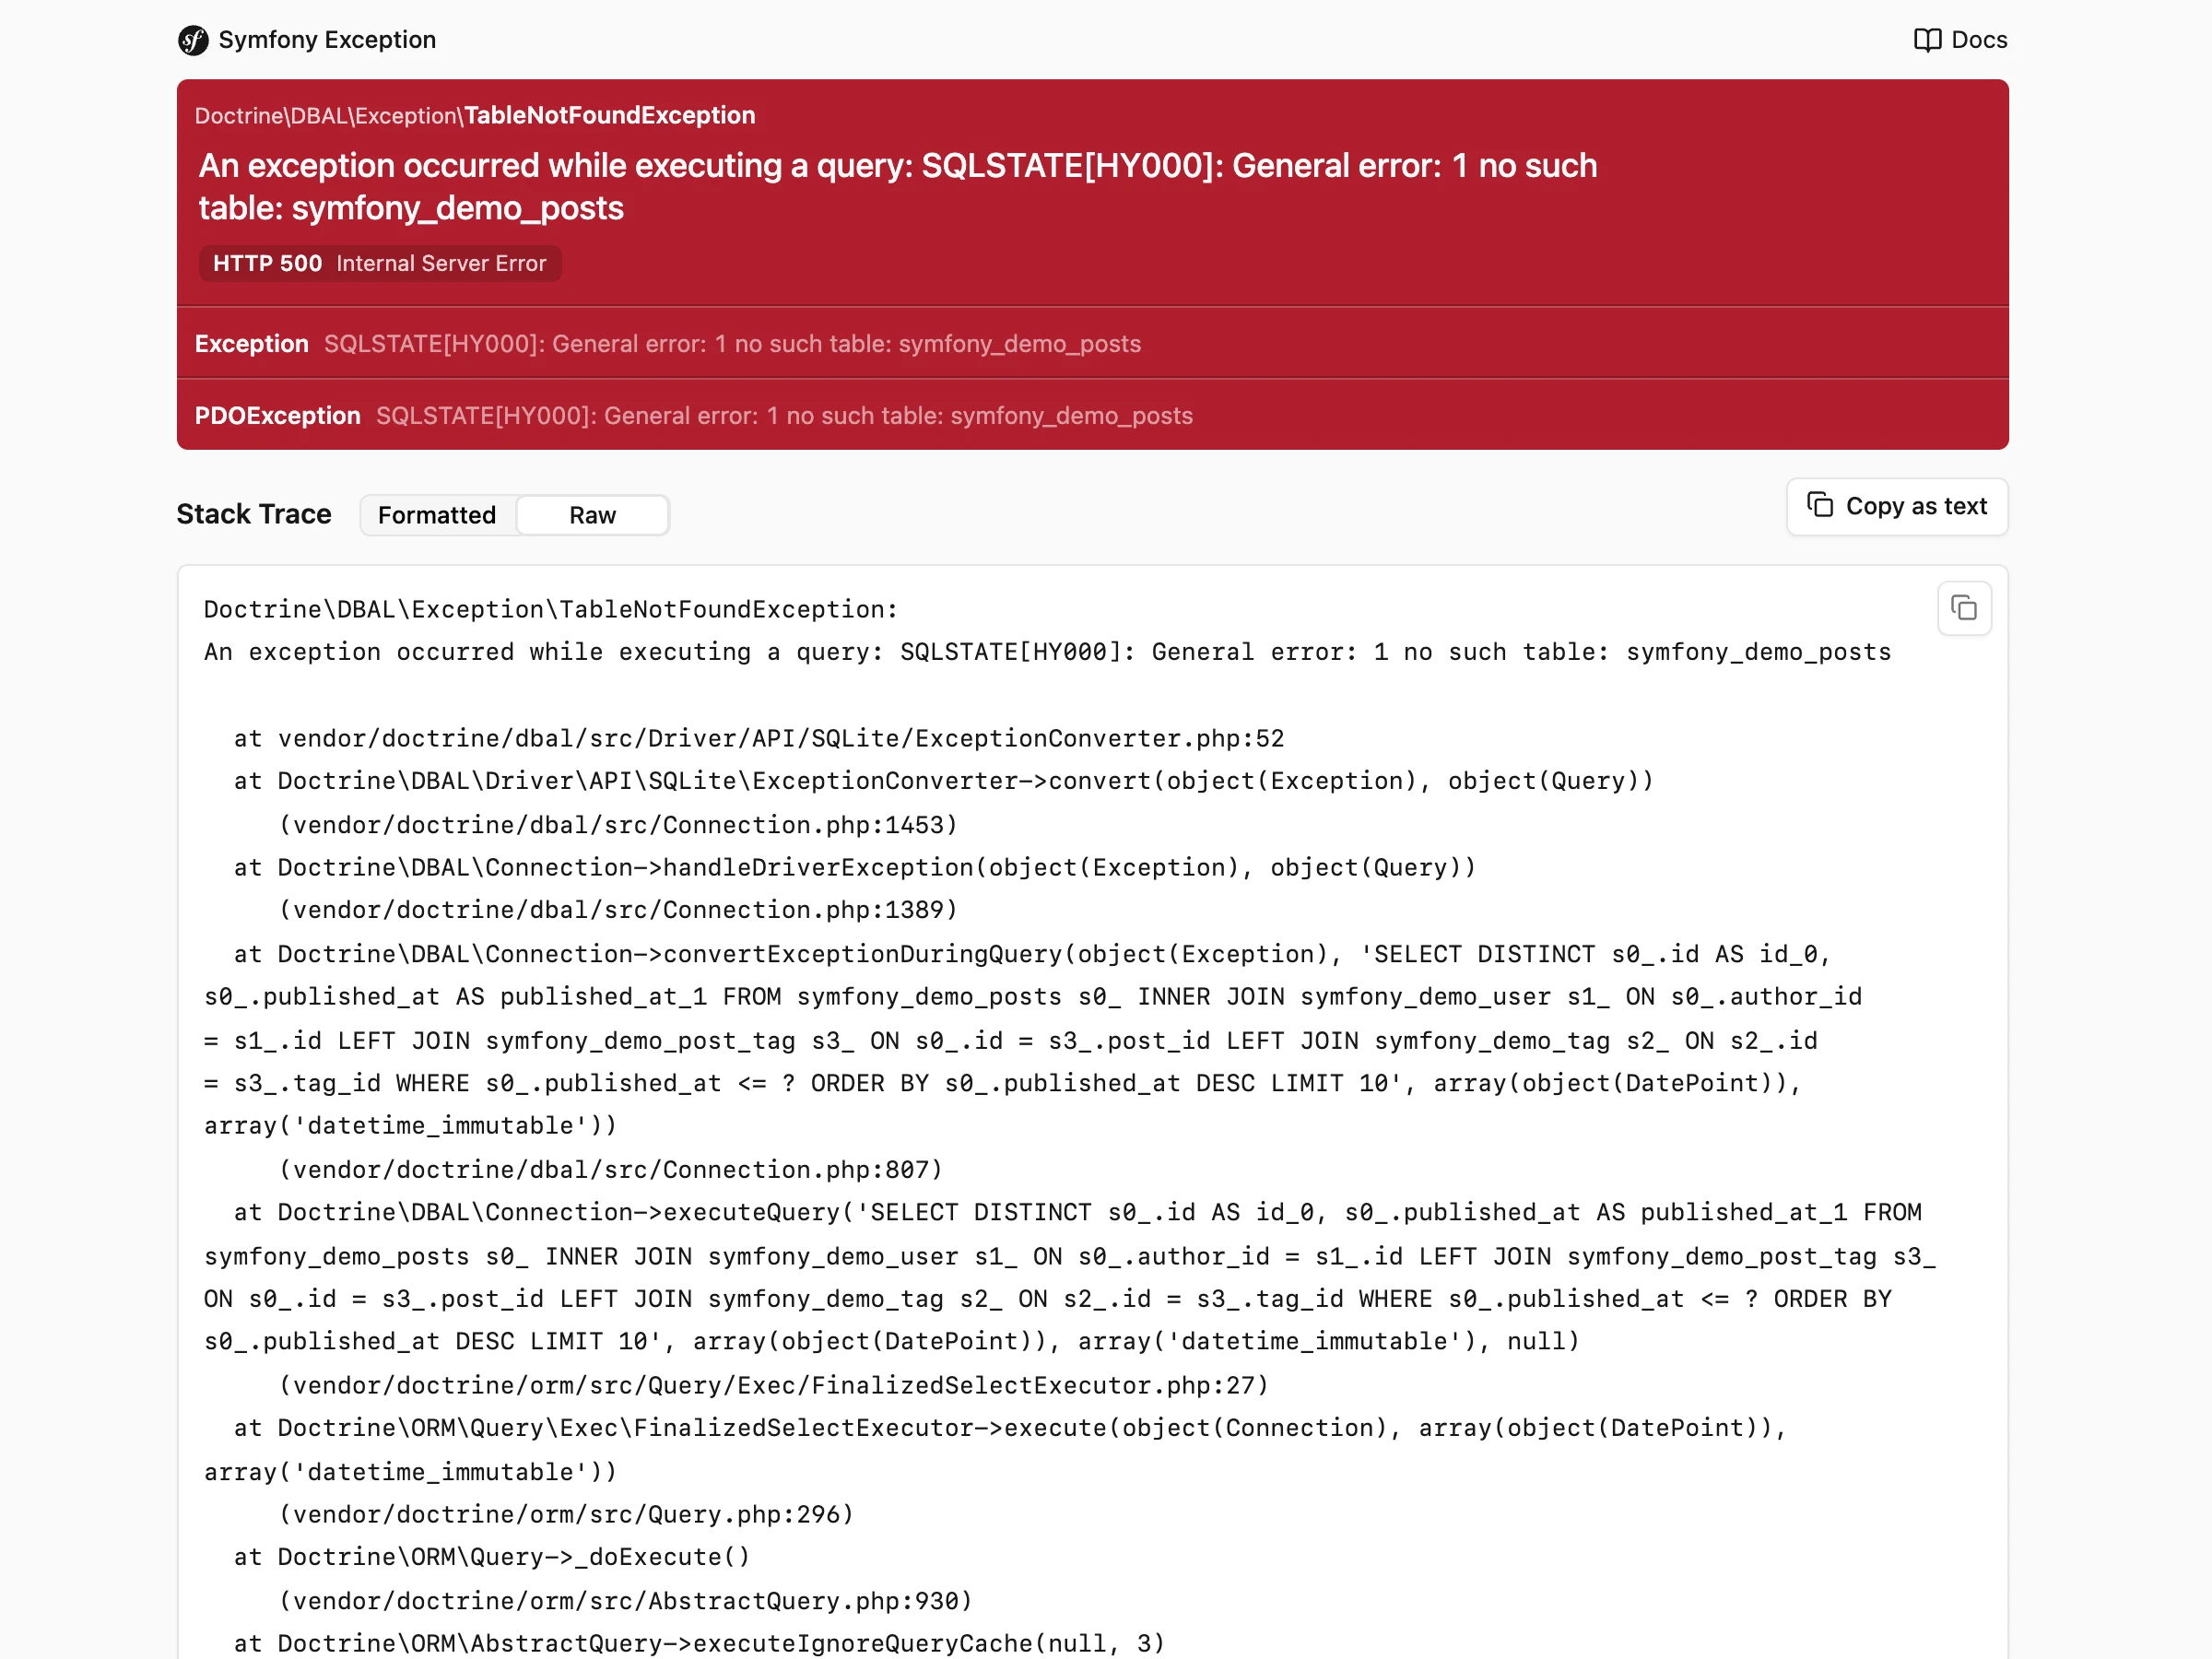
The old Stack Trace tab, which displayed the trace as plain text, is now the
Raw format of the stack trace section:
Copy as Text
The new Copy as text button copies the stack trace and the logs of the exception as plain text, with paths relative to your project directory. This is useful to paste the error in a bug report, a chat with your team or the prompt of your AI assistant:
1
2
3
4
5
6
7
8
9
10
11
12
13
14
15
16
17
18
19
20
21
22
23
24
### Stack trace

```
Doctrine\DBAL\Exception\TableNotFoundException:
An exception occurred while executing a query: SQLSTATE[HY000]: General error: 1 no such table: symfony_demo_posts

  at vendor/doctrine/dbal/src/Driver/API/SQLite/ExceptionConverter.php:52
  [...]
  at Doctrine\ORM\Tools\Pagination\Paginator->getIterator()
     (src/Pagination/Paginator.php:71)
  at App\Pagination\Paginator->paginate(1)
     (src/Repository/PostRepository.php:60)
  at App\Repository\PostRepository->findLatest(1, null)
     (src/Controller/BlogController.php:60)
  [...]
```

### Logs

```
[2026-11-13T11:54:45.296+00:00] request.INFO: Matched route "blog_index". {"route":"blog_index", ...}
[2026-11-13T11:54:45.299+00:00] doctrine.INFO: Connecting with parameters {params} {"params":{"driver":"pdo_sqlite", ...}}
[2026-11-13T11:54:45.299+00:00] request.CRITICAL: Uncaught PHP Exception Doctrine\DBAL\Exception\TableNotFoundException: [...]
```
Better Logs
In previous versions, the Logs tab displayed all messages with their full
context, which resulted in a very long list even for simple requests. In
Symfony 8.2, logs are displayed below the stack trace and only the error
messages are expanded by default. Click on any other message to see its context
or use the "Expand all" button to see all of them:
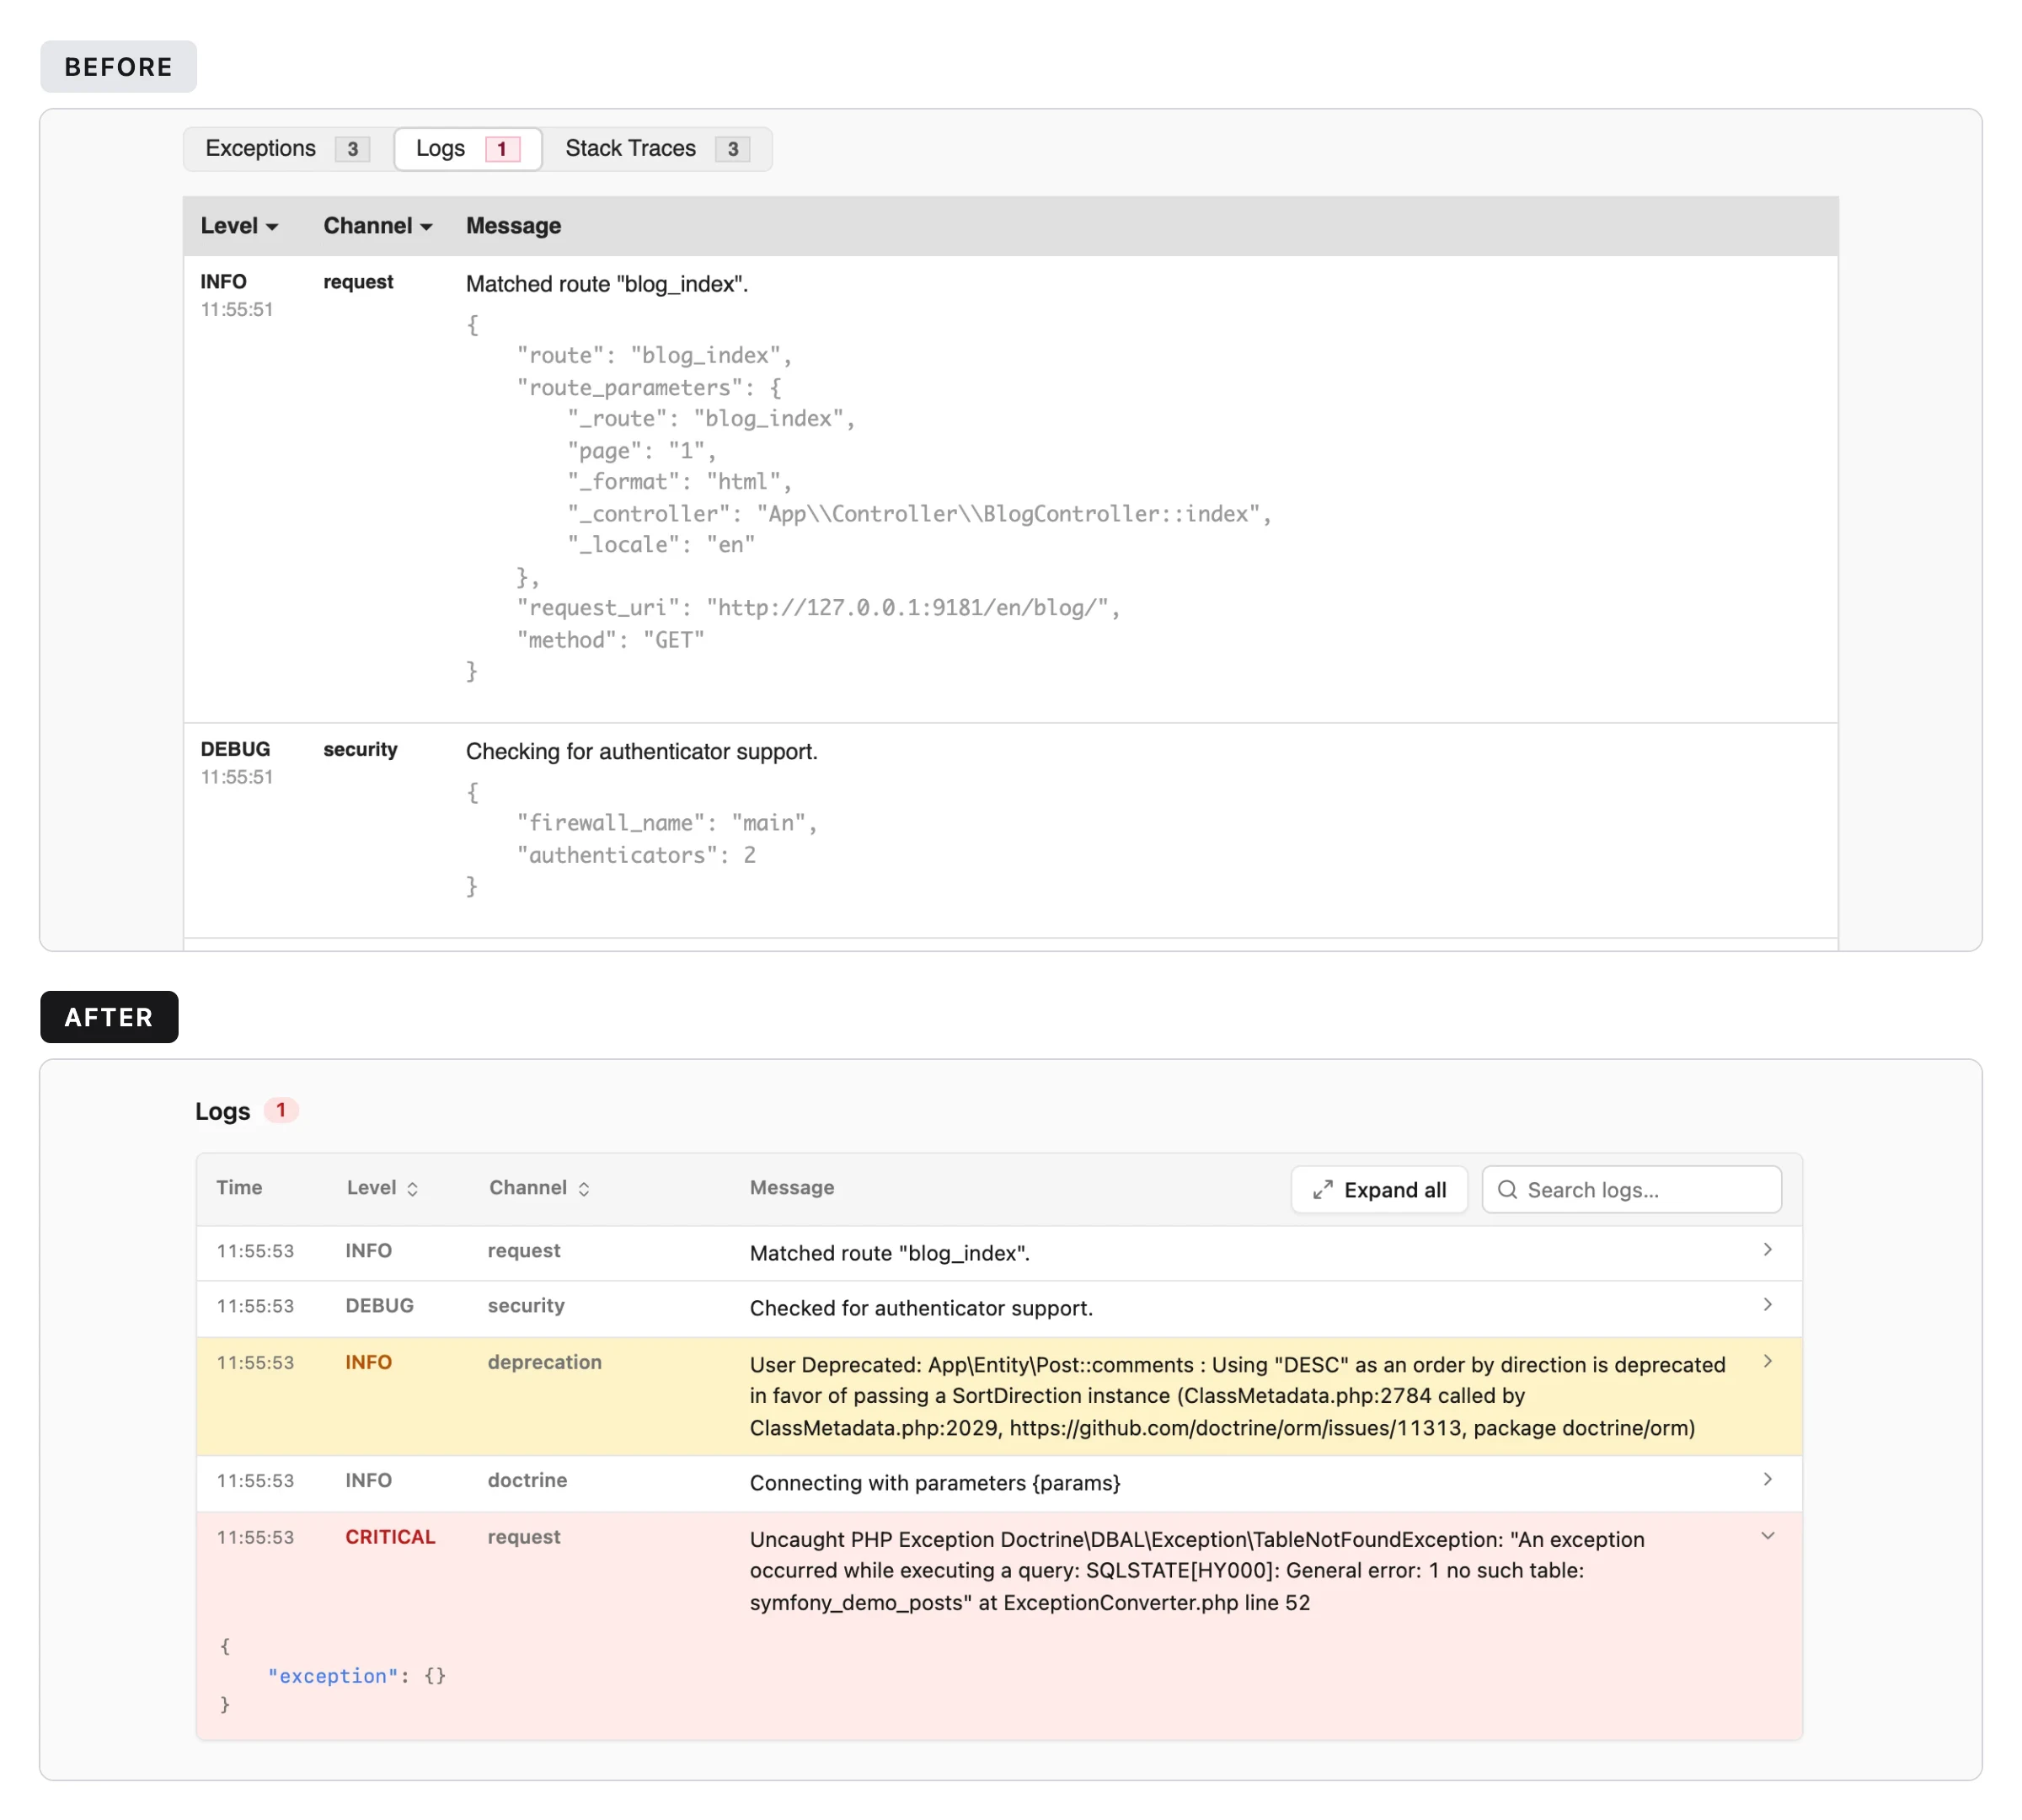
You can still filter messages by level and channel, and the new search box filters them by their message and context,
CSP Nonce Support
The exception page includes its CSS and JavaScript code inline, so it works without loading any external asset. However, if your application sends a strict Content Security Policy, the browser blocks those inline styles and scripts and the page loses its formatting and its interactive features.
In Symfony 8.2, the HtmlErrorRenderer class provides a setNonce() method
to set the CSP nonce added to the <script> and <style> tags of the
error pages. You can pass the nonce as a string or as a closure, which is called
once for each rendered page:
1
2
3
4
5
6
7
8
use Symfony\Component\ErrorHandler\ErrorRenderer\HtmlErrorRenderer;

/** @var HtmlErrorRenderer $renderer */
$renderer->setNonce(
    // this example assumes that your application stores the nonce in this
    // request attribute; use the same nonce that you send in the CSP header
    static fn () => $requestStack->getCurrentRequest()?->attributes->get('_csp_nonce')
);
If your policy uses different nonces for scripts and styles, pass the nonce of
the styles as the second argument of setNonce().