The Symfony profiler is a powerful development tool that gives you detailed information about the execution of any request. In Symfony 5.2 we've improved it with session profiling, which displays all the information related to the session of the current request.
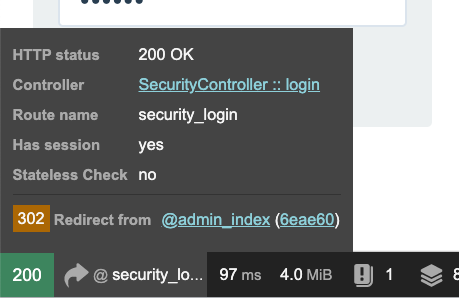
First, the debug toolbar now tells you if the current page is using the session or not and the if the session check was stateless:

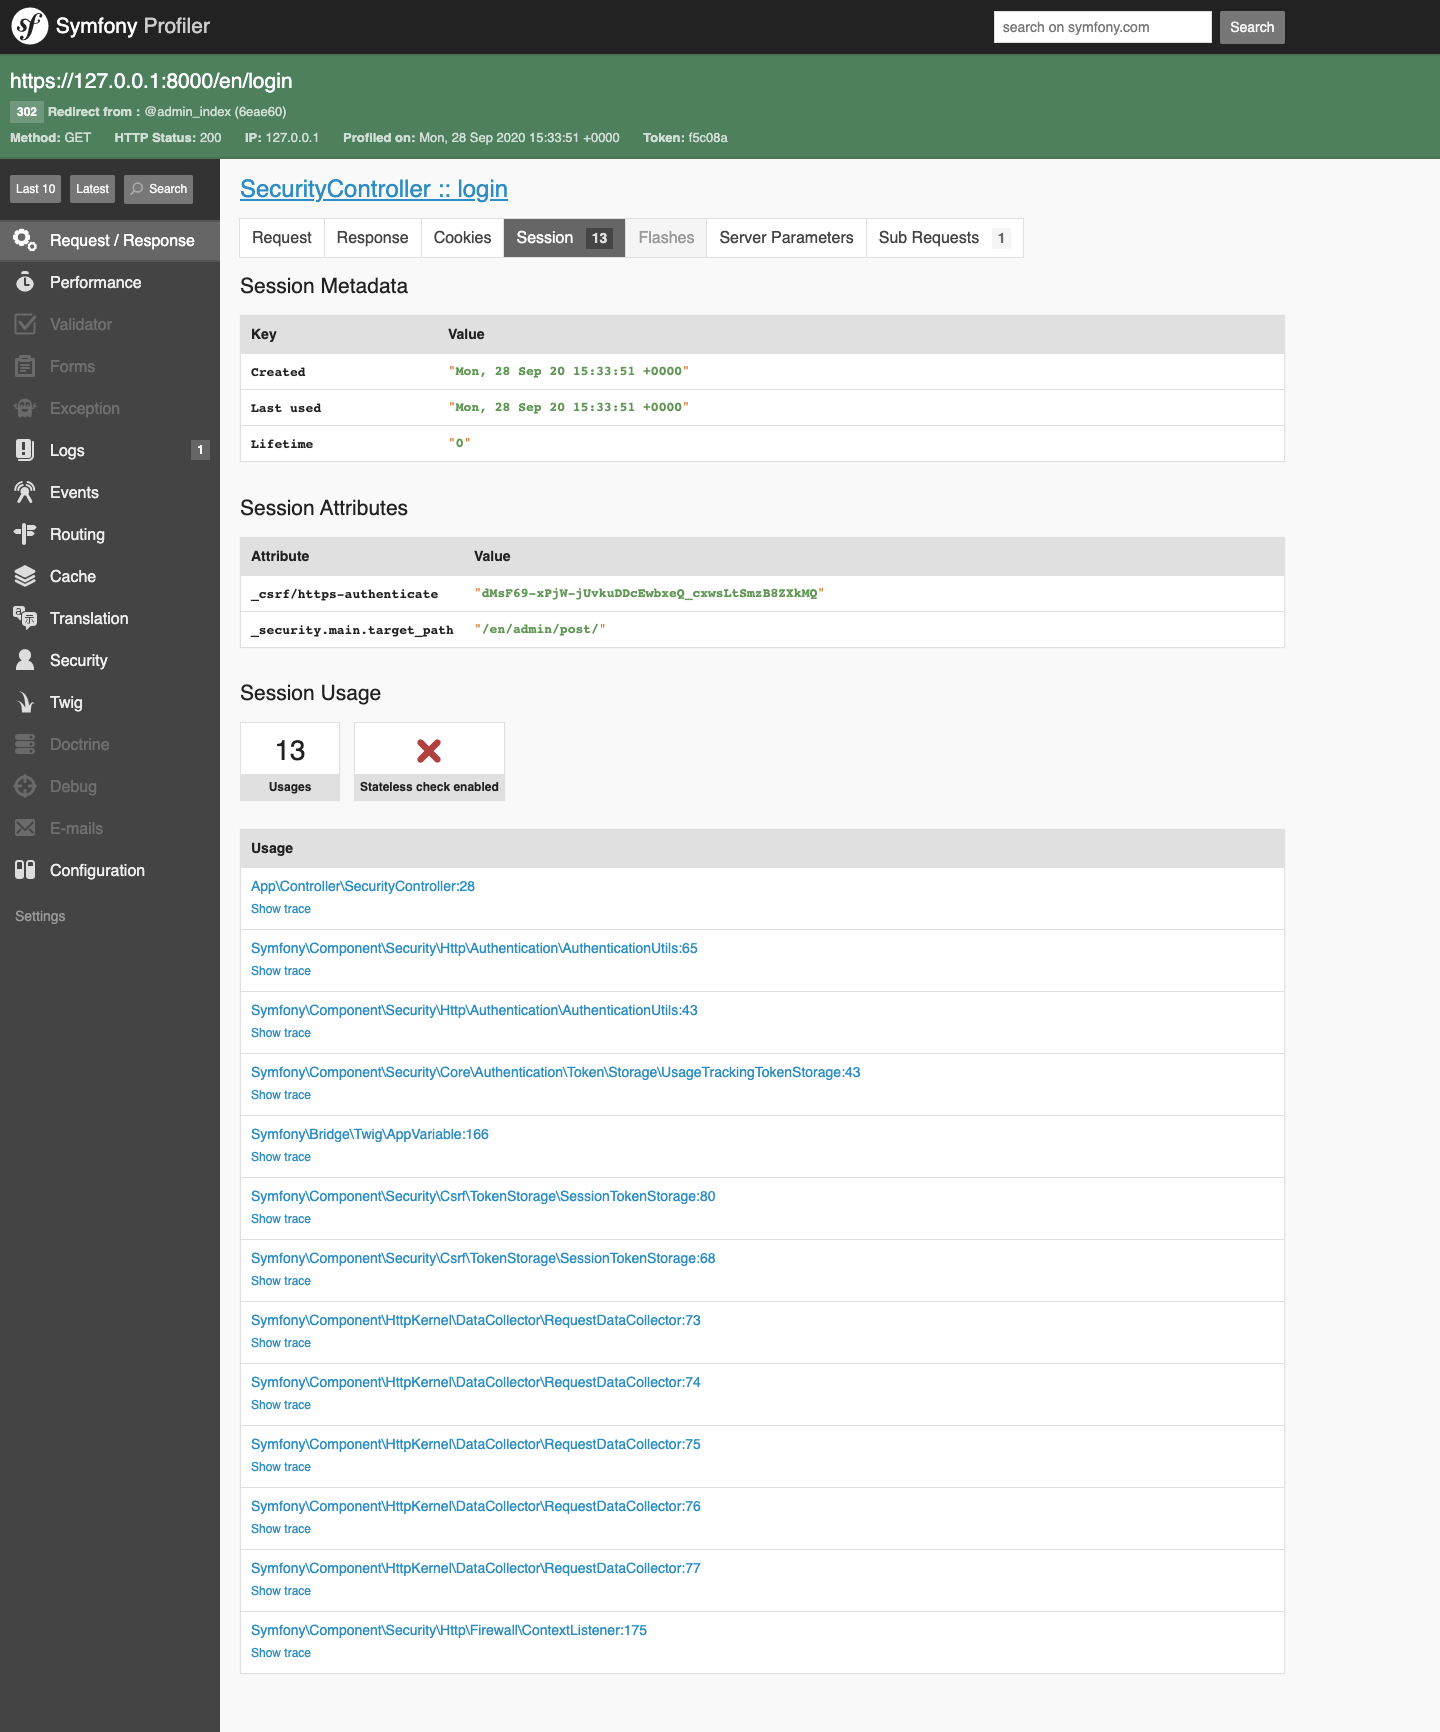
In addition, the profiler now displays a new section called Session in the Request/Response panel. It displays the session metadata (e.g. creation date, lifetime, etc.), the session attributes names and values, and the full details of all session usages, including PHP backtraces:

Nice one ! Thanks @Mathias
👍👍 @Mathias
Thanks !
It's perfect ! Thanks @Mathias
Nice Mathias ! :)