Profiler
The profiler is a powerful development tool that gives detailed information about the execution of any request.
Danger
Never enable the profiler in production environments as it will lead to major security vulnerabilities in your project.
Installation
In applications using Symfony Flex, run this command to
install the profiler Symfony pack before using it:
1
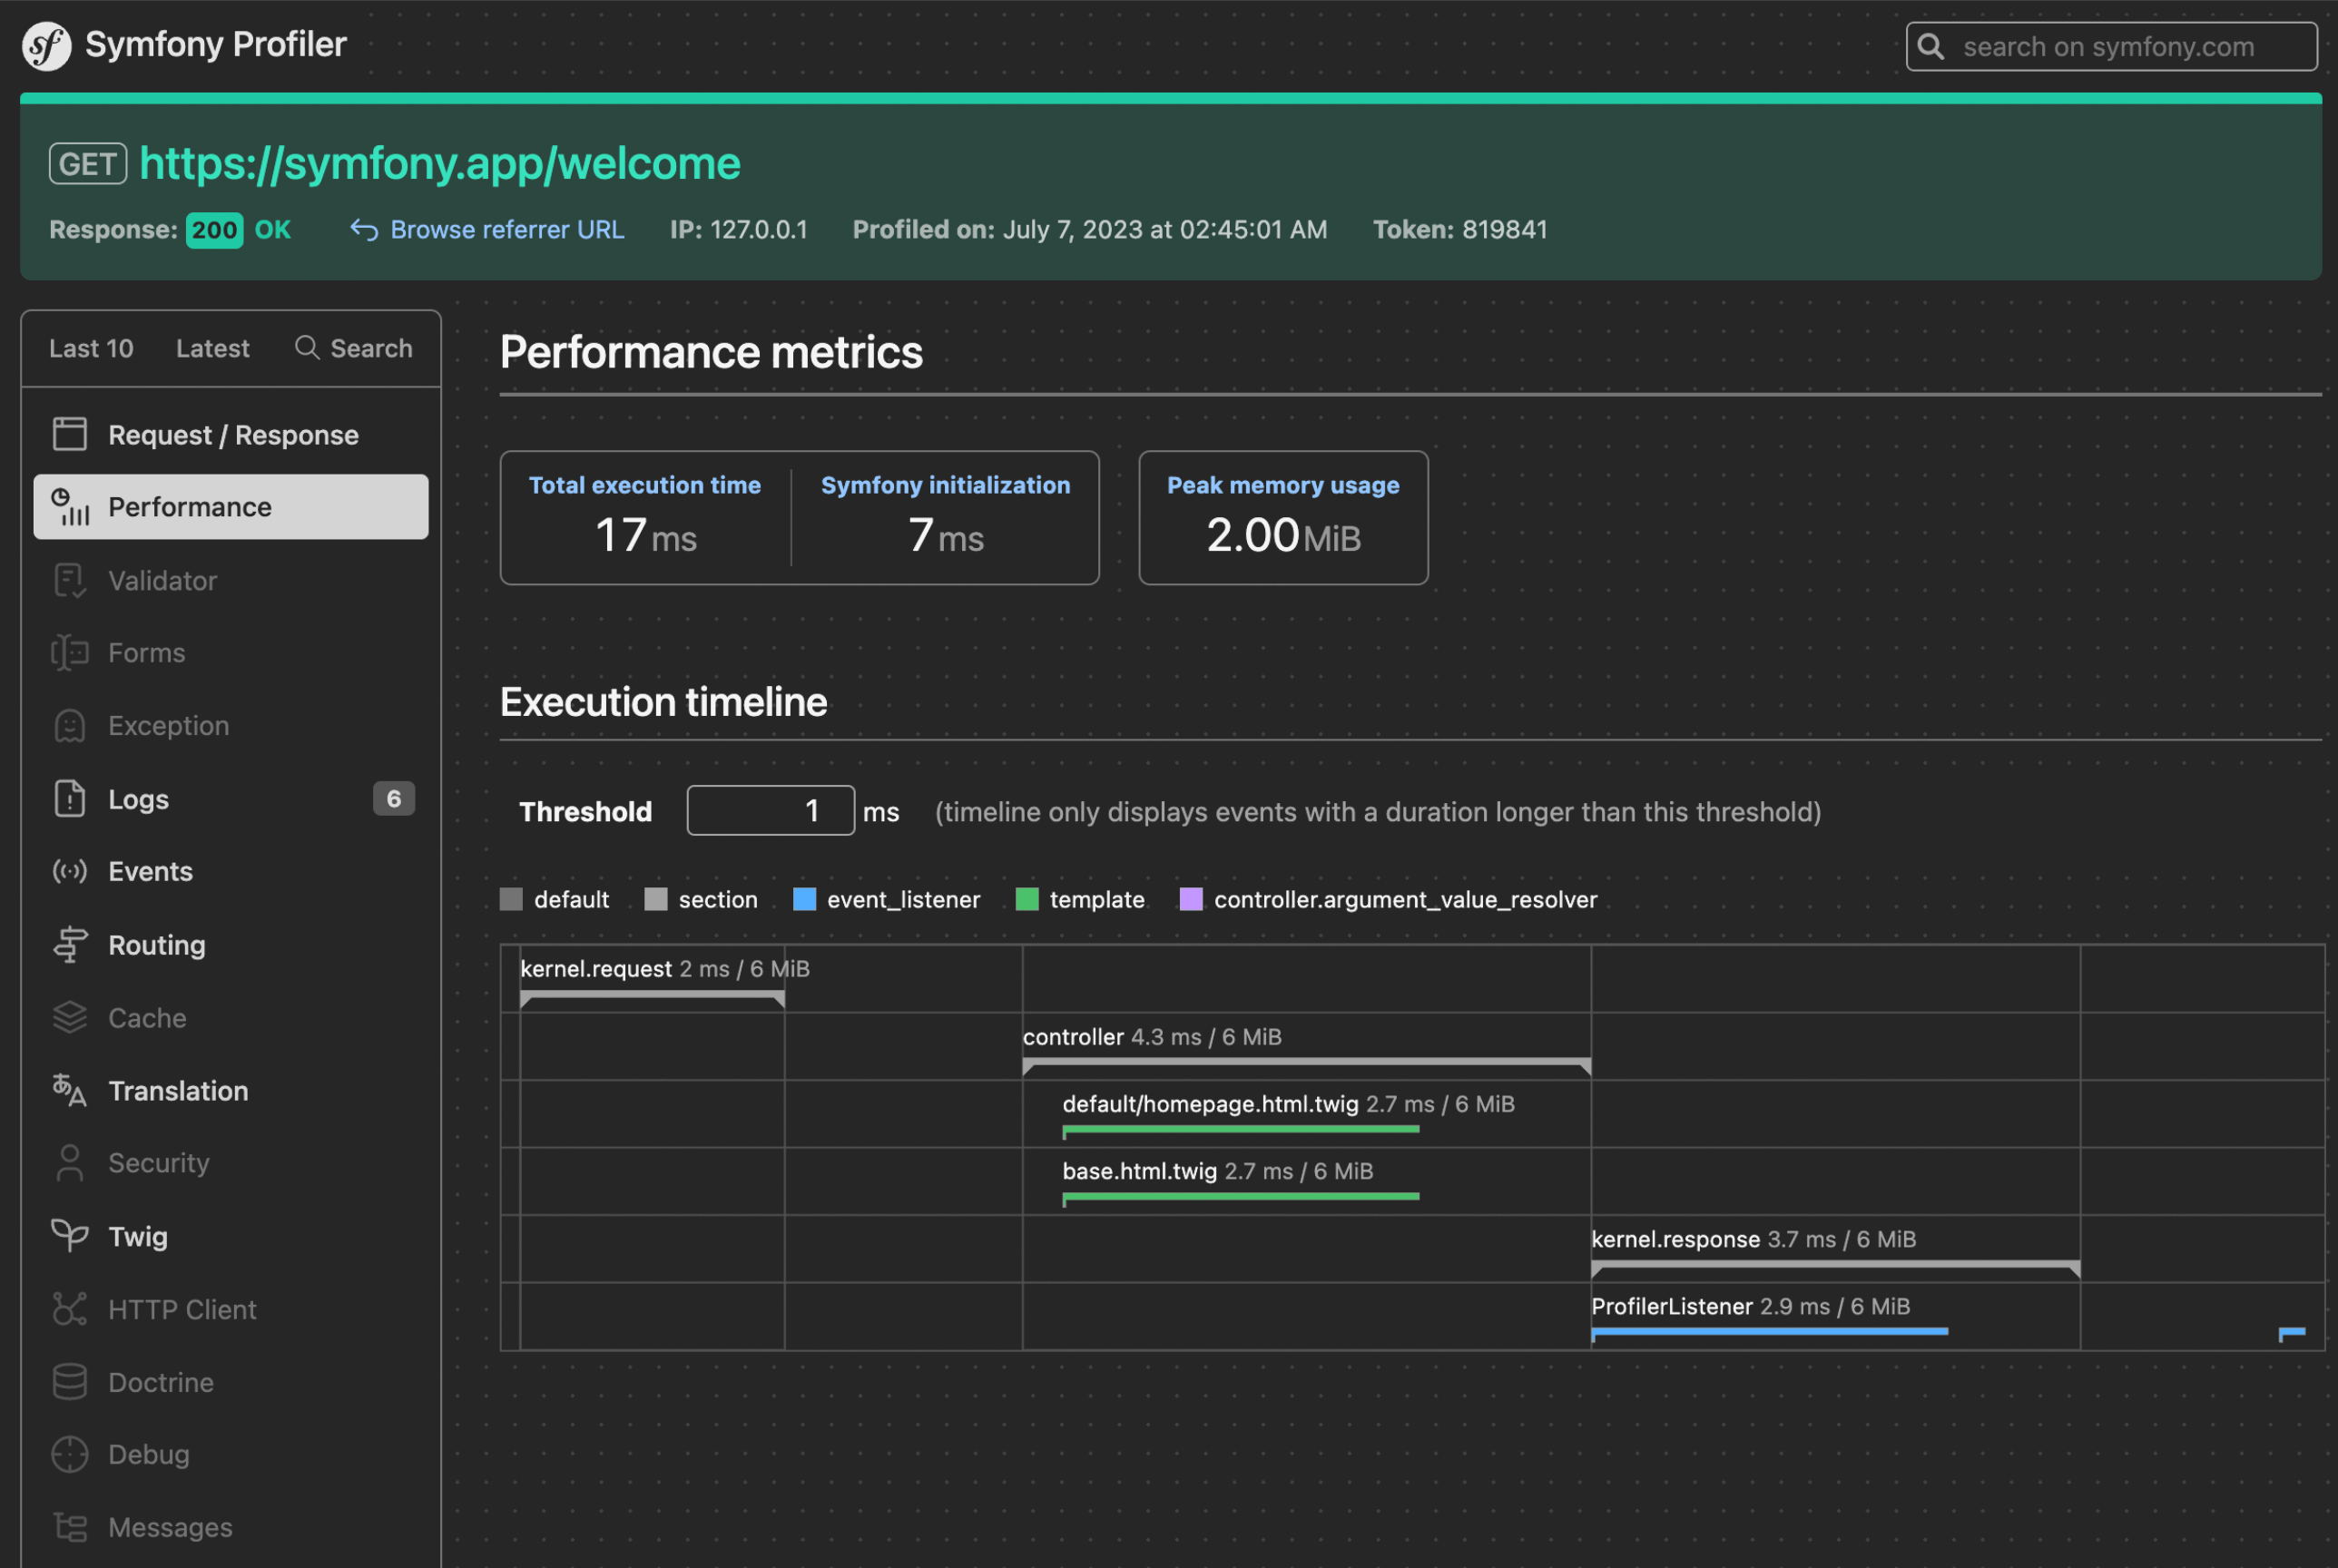
$ composer require --dev symfony/profiler-packNow, browse any page of your application in the development environment to let the profiler collect information. Then, click on any element of the debug toolbar injected at the bottom of your pages to open the web interface of the Symfony Profiler, which will look like this:
Note
The debug toolbar is only injected into HTML responses. For other kinds of
contents (e.g. JSON responses in API requests) the profiler URL is available
in the X-Debug-Token-Link HTTP response header. Browse the /_profiler
URL to see all profiles.
Note
To limit the storage used by profiles on disk, they are probabilistically removed after 2 days.
Accessing Profiling Data Programmatically
Most of the time, the profiler information is accessed and analyzed using its
web-based interface. However, you can also retrieve profiling information
programmatically thanks to the methods provided by the profiler service.
When the response object is available, use the loadProfileFromResponse() method to access to its associated profile:
1
2
// ... $profiler is the 'profiler' service
$profile = $profiler->loadProfileFromResponse($response);
Note
The profiler service will be autowired
automatically when type-hinting any service argument with the
Profiler class.
When the profiler stores data about a request, it also associates a token with it;
this token is available in the X-Debug-Token HTTP header of the response.
Using this token, you can access the profile of any past response thanks to the
loadProfile() method:
1
2
$token = $response->headers->get('X-Debug-Token');
$profile = $profiler->loadProfile($token);
Tip
When the profiler is enabled but not the web debug toolbar, inspect the page
with your browser's developer tools to get the value of the X-Debug-Token
HTTP header.
The profiler service also provides the
find() method to
look for tokens based on some criteria:
1
2
3
4
5
6
7
8
9
10
11
12
13
14
// gets the latest 10 tokens
$tokens = $profiler->find('', '', 10, '', '', '');

// gets the latest 10 tokens for all URLs containing /admin/
$tokens = $profiler->find('', '/admin/', 10, '', '', '');

// gets the latest 10 tokens for all URLs not containing /api/
$tokens = $profiler->find('', '!/api/', 10, '', '', '');

// gets the latest 10 tokens for local POST requests
$tokens = $profiler->find('127.0.0.1', '', 10, 'POST', '', '');

// gets the latest 10 tokens for requests that happened between 2 and 4 days ago
$tokens = $profiler->find('', '', 10, '', '4 days ago', '2 days ago');
Data Collectors
The profiler gets its information using some services called "data collectors". Symfony comes with several collectors that get information about the request, the logger, the routing, the cache, etc.
Run this command to get the list of collectors actually enabled in your app:
1
$ php bin/console debug:container --tag=data_collectorYou can also create your own data collector to store any data generated by your app and display it in the debug toolbar and the profiler web interface.
Timing the Execution of the Application
If you want to measure the time some tasks take in your application, there's no need to create a custom data collector. Instead, use the built-in utilities to profile Symfony applications.
Tip
Consider using a professional profiler such as Blackfire to measure and analyze the execution of your application in detail.
Enabling the Profiler Programmatically or Conditionally
Symfony Profiler can be enabled and disabled programmatically. You can use the enable()
and disable() methods of the Profiler
class in your controllers to manage the profiler programmatically:
1
2
3
4
5
6
7
8
9
10
11
12
13
14
15
16
17
18
use Symfony\Component\HttpKernel\Profiler\Profiler;
// ...

class DefaultController
{
    // ...

    public function someMethod(?Profiler $profiler): Response
    {
        // $profiler won't be set if your environment doesn't have the profiler (like prod, by default)
        if (null !== $profiler) {
            // if it exists, disable the profiler for this particular controller action
            $profiler->disable();
        }

        // ...
    }
}
In order for the profiler to be injected into your controller you need to
create an alias pointing to the existing profiler service:
1
2
3
4
# config/services.yaml
when@dev:
    services:
Symfony\Component\HttpKernel\Profiler\Profiler: '@profiler'Enabling the Profiler Conditionally
Instead of enabling the profiler programmatically as explained in the previous section, you can also enable it when a certain condition is met (e.g. a certain parameter is included in the URL):
1 2 3 4 5 6
# config/packages/web_profiler.yaml
when@dev:
framework:
profiler:
collect: false
collect_parameter: 'profile'1 2 3 4 5 6 7 8 9 10 11 12 13
// config/packages/web_profiler.php
namespace Symfony\Component\DependencyInjection\Loader\Configurator;
return App::config([
'when@dev' => [
'framework' => [
'profiler' => [
'collect' => false,
'collect_parameter' => 'profile',
],
],
],
]);This configuration disables the profiler by default (collect: false) to
improve the application performance; but enables it for requests that include a
query parameter called profile (you can freely choose this query parameter name).
In addition to the query parameter, this feature also works when submitting a
form field with that name (useful to enable the profiler in POST requests)
or when including it as a request attribute.
Updating the Web Debug Toolbar After AJAX Requests
Single-page applications (SPA) are web applications that interact with the user by dynamically rewriting the current page rather than loading entire new pages from a server.
By default, the debug toolbar displays the information of the initial page load
and doesn't refresh after each AJAX request. However, you can configure the
toolbar to be refreshed after each AJAX request by enabling ajax_replace in the
web_profiler configuration:
1 2 3 4
# config/packages/web_profiler.yaml
web_profiler:
toolbar:
ajax_replace: trueIf you need a more sophisticated solution, you can set the
Symfony-Debug-Toolbar-Replace header to a value of '1' in the response
yourself:
1
$response->headers->set('Symfony-Debug-Toolbar-Replace', '1');Ideally this header should only be set during development and not for production. To do that, create an event subscriber and listen to the kernel.response event:
1 2 3 4 5 6 7 8 9 10 11 12 13 14 15 16 17 18 19 20
use Symfony\Component\DependencyInjection\Attribute\When;
use Symfony\Component\EventDispatcher\EventSubscriberInterface;
use Symfony\Component\HttpKernel\Event\ResponseEvent;
use Symfony\Component\HttpKernel\KernelInterface;
// ...
#[When(env: 'dev')]
class MySubscriber implements EventSubscriberInterface
{
// ...
public function onKernelResponse(ResponseEvent $event): void
{
// Your custom logic here
$response = $event->getResponse();
$response->headers->set('Symfony-Debug-Toolbar-Replace', '1');
}
}Creating a Data Collector
The Symfony Profiler obtains its profiling and debug information using some special classes called data collectors. Symfony comes bundled with a few of them, but you can also create your own.
A data collector is a PHP class that implements the
DataCollectorInterface.
For convenience, your data collectors can also extend from the
AbstractDataCollector
class, which implements the interface and provides some utilities and the
$this->data property to store the collected information.
The following example shows a custom collector that stores information about the request:
1 2 3 4 5 6 7 8 9 10 11 12 13 14 15 16 17
// src/DataCollector/RequestCollector.php
namespace App\DataCollector;
use Symfony\Bundle\FrameworkBundle\DataCollector\AbstractDataCollector;
use Symfony\Component\HttpFoundation\Request;
use Symfony\Component\HttpFoundation\Response;
class RequestCollector extends AbstractDataCollector
{
public function collect(Request $request, Response $response, ?\Throwable $exception = null): void
{
$this->data = [
'method' => $request->getMethod(),
'acceptable_content_types' => $request->getAcceptableContentTypes(),
];
}
}These are the method that you can define in the data collector class:
- collect() method:
-
Stores the collected data in local properties (
$this->dataif you extend fromAbstractDataCollector). If you need some services to collect the data, inject those services in the data collector constructor.Warning
The
collect()method is only called once. It is not used to "gather" data but is there to "pick up" the data that has been stored by your service.Warning
As the profiler serializes data collector instances, you should not store objects that cannot be serialized (like PDO objects) or you need to provide your own
serialize()method. - reset() method:
-
It's called between requests to reset the state of the profiler. By default
it only empties the
$this->datacontents, but you can override this method to do additional cleaning. - getName() method:
-
Returns the collector identifier, which must be unique in the application.
By default it returns the FQCN of the data collector class, but you can
override this method to return a custom name (e.g.
app.request_collector). This value is used later to access the collector information (see How to Use the Profiler in a Functional Test) so you may prefer using short strings instead of FQCN strings.
The collect() method is called during the kernel.response
event. If you need to collect data that is only available later, implement
LateDataCollectorInterface
and define the lateCollect() method, which is invoked right before the profiler
data serialization (during kernel.terminate event).
Note
If you're using the default services.yaml configuration
with autoconfigure, then Symfony will start using your data collector after the
next page refresh. Otherwise, enable the data collector by hand.
Supporting a Disabled Profiler
Some data collectors rely on a decorated traceable service to gather data.
Because the profiler can be disabled at runtime, you should check its state
inside the traceable service to avoid collecting data unnecessarily. Inject the
profiler.is_disabled_state_checker service to do this:
1 2 3 4 5 6 7 8 9 10 11 12 13 14 15 16 17 18 19 20 21 22 23 24 25 26 27 28 29 30 31 32 33 34 35 36 37 38 39 40 41 42 43 44
// src/Debug/TraceableService.php
namespace App\Debug;
use Symfony\Component\HttpFoundation\Request;
use Symfony\Component\HttpFoundation\Response;
class TraceableService implements ServiceInterface
{
public function __construct(
private ServiceInterface $decoratedService,
protected readonly ?\Closure $disabled = null, // profiler.is_disabled_state_checker
) {}
public function action(): array
{
if ($this->disabled?->__invoke()) {
return $this->decoratedService->action();
}
// gather data to be collected by your data collector
return [/* ... data ... */];
}
}
// src/DataCollector/ServiceCollector.php
namespace App\DataCollector;
use Symfony\Bundle\FrameworkBundle\DataCollector\AbstractDataCollector;
use Symfony\Component\HttpFoundation\Request;
use Symfony\Component\HttpFoundation\Response;
class ServiceCollector extends AbstractDataCollector
{
public function __construct(
private ServiceInterface $service, // TraceableService
) {}
public function collect(Request $request, Response $response, ?\Throwable $exception = null): void
{
$this->data = [
'data' => $this->service->action(),
];
}
}Adding Web Profiler Templates
The information collected by your data collector can be displayed both in the web debug toolbar and in the web profiler. To do so, you need to create a Twig template that includes some specific blocks.
First, add the getTemplate() method in your data collector class to return
the path of the Twig template to use. Then, add some getters to give the
template access to the collected information:
1 2 3 4 5 6 7 8 9 10 11 12 13 14 15 16 17 18 19 20 21 22 23 24 25 26 27 28 29 30 31
// src/DataCollector/RequestCollector.php
namespace App\DataCollector;
use Symfony\Bundle\FrameworkBundle\DataCollector\AbstractDataCollector;
use Symfony\Component\VarDumper\Cloner\Data;
class RequestCollector extends AbstractDataCollector
{
// ...
public static function getTemplate(): ?string
{
return 'data_collector/template.html.twig';
}
public function getMethod(): string
{
return $this->data['method'];
}
public function getAcceptableContentTypes(): array
{
return $this->data['acceptable_content_types'];
}
public function getSomeObject(): Data
{
// use the cloneVar() method to dump collected data in the profiler
return $this->cloneVar($this->data['method']);
}
}In the simplest case, you want to display the information in the toolbar
without providing a profiler panel. This requires defining the toolbar
block and set the value of two variables called icon and text:
1 2 3 4 5 6 7 8 9 10 11 12 13 14 15 16 17 18 19 20 21 22 23 24 25 26 27 28
{# templates/data_collector/template.html.twig #}
{% extends '@WebProfiler/Profiler/layout.html.twig' %}
{% block toolbar %}
{% set icon %}
{# this is the content displayed as a panel in the toolbar #}
<svg xmlns="http://www.w3.org/2000/svg"> ... </svg>
<span class="sf-toolbar-value">Request</span>
{% endset %}
{% set text %}
{# this is the content displayed when hovering the mouse over
the toolbar panel #}
<div class="sf-toolbar-info-piece">
<b>Method</b>
<span>{{ collector.method }}</span>
</div>
<div class="sf-toolbar-info-piece">
<b>Accepted content type</b>
<span>{{ collector.acceptableContentTypes|join(', ') }}</span>
</div>
{% endset %}
{# the 'link' value set to 'false' means that this panel doesn't
show a section in the web profiler #}
{{ include('@WebProfiler/Profiler/toolbar_item.html.twig', { link: false }) }}
{% endblock %}Tip
Symfony Profiler icons are selected from Tabler icons, a large and open source collection of SVG icons. It's recommended to also use those icons for your own profiler panels to get a consistent look.
Tip
Built-in collector templates define all their images as embedded SVG files. This makes them work everywhere without having to mess with web assets links:
1 2 3 4
{% set icon %}
{{ include('data_collector/icon.svg') }}
{# ... #}
{% endset %}If the toolbar panel includes extended web profiler information, the Twig template must also define additional blocks:
1 2 3 4 5 6 7 8 9 10 11 12 13 14 15 16 17 18 19 20 21 22 23 24 25 26 27 28 29 30 31 32 33 34 35 36 37 38 39 40 41 42 43 44 45 46 47 48 49 50
{# templates/data_collector/template.html.twig #}
{% extends '@WebProfiler/Profiler/layout.html.twig' %}
{% block toolbar %}
{% set icon %}
{# ... #}
{% endset %}
{% set text %}
<div class="sf-toolbar-info-piece">
{# ... #}
</div>
{% endset %}
{{ include('@WebProfiler/Profiler/toolbar_item.html.twig', { 'link': true }) }}
{% endblock %}
{% block head %}
{# Optional. Here you can link to or define your own CSS and JS contents. #}
{# Use {{ parent() }} to extend the default styles instead of overriding them. #}
{% endblock %}
{% block menu %}
{# This left-hand menu appears when using the full-screen profiler. #}
<span class="label">
<span class="icon"><img src="..." alt=""/></span>
<strong>Request</strong>
</span>
{% endblock %}
{% block panel %}
{# Optional, for showing the most details. #}
<h2>Acceptable Content Types</h2>
<table>
<tr>
<th>Content Type</th>
</tr>
{% for type in collector.acceptableContentTypes %}
<tr>
<td>{{ type }}</td>
</tr>
{% endfor %}
{# use the profiler_dump() function to render the contents of dumped objects #}
<tr>
{{ profiler_dump(collector.someObject) }}
</tr>
</table>
{% endblock %}The menu and panel blocks are the only required blocks to define the
contents displayed in the web profiler panel associated with this data collector.
All blocks have access to the collector object.
Note
The position of each panel in the toolbar is determined by the collector priority, which can only be defined when configuring the data collector by hand.
Note
If you're using the default services.yaml configuration
with autoconfigure, then Symfony will start displaying your collector data
in the toolbar after the next page refresh. Otherwise, enable the data collector by hand.
Enabling Custom Data Collectors
If you don't use Symfony's default configuration with autowire and autoconfigure you'll need to configure the data collector explicitly:
1 2 3 4 5 6 7 8 9 10 11 12
# config/services.yaml
services:
    App\DataCollector\RequestCollector:
        tags:
            -
                name: data_collector
                # must match the value returned by the getName() method
                id: 'App\DataCollector\RequestCollector'
                # optional template (it has more priority than the value returned by getTemplate())
                template: 'data_collector/template.html.twig'
                # optional priority (positive or negative integer; default = 0)
                # priority: 300