This is the last blog post about the new features of Symfony 6.4 and 7.0. This blog series started with the new command profiler, a revolutionary feature to introspect the execution of Symfony commands so you can debug them.
In Symfony 6.4 we've also improved the Symfony profiler with a feature to profile workflows. First, define any number of workflows in your application via the Workflow component. Then , upgrade your project to Symfony 6.4 or higher.
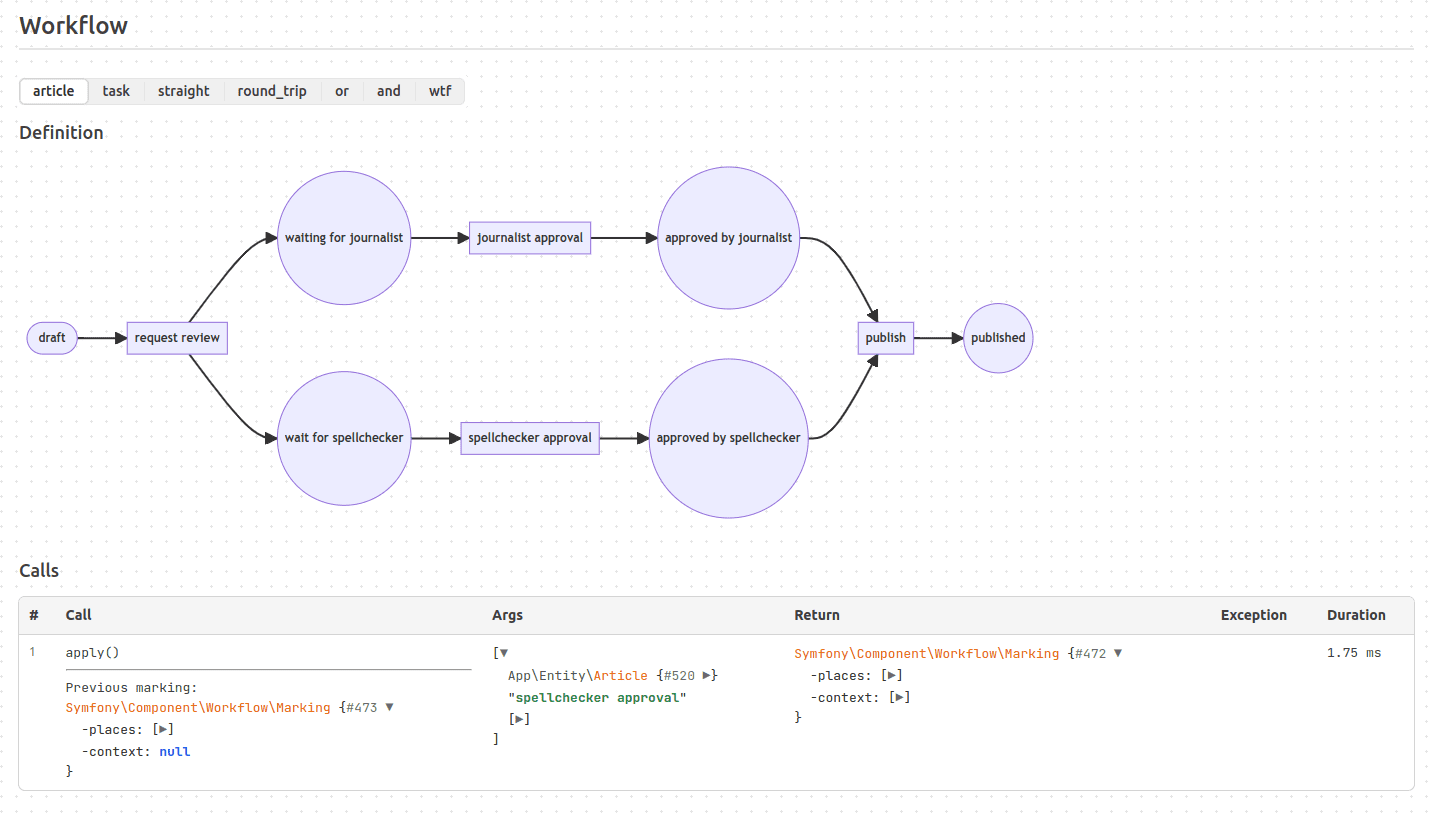
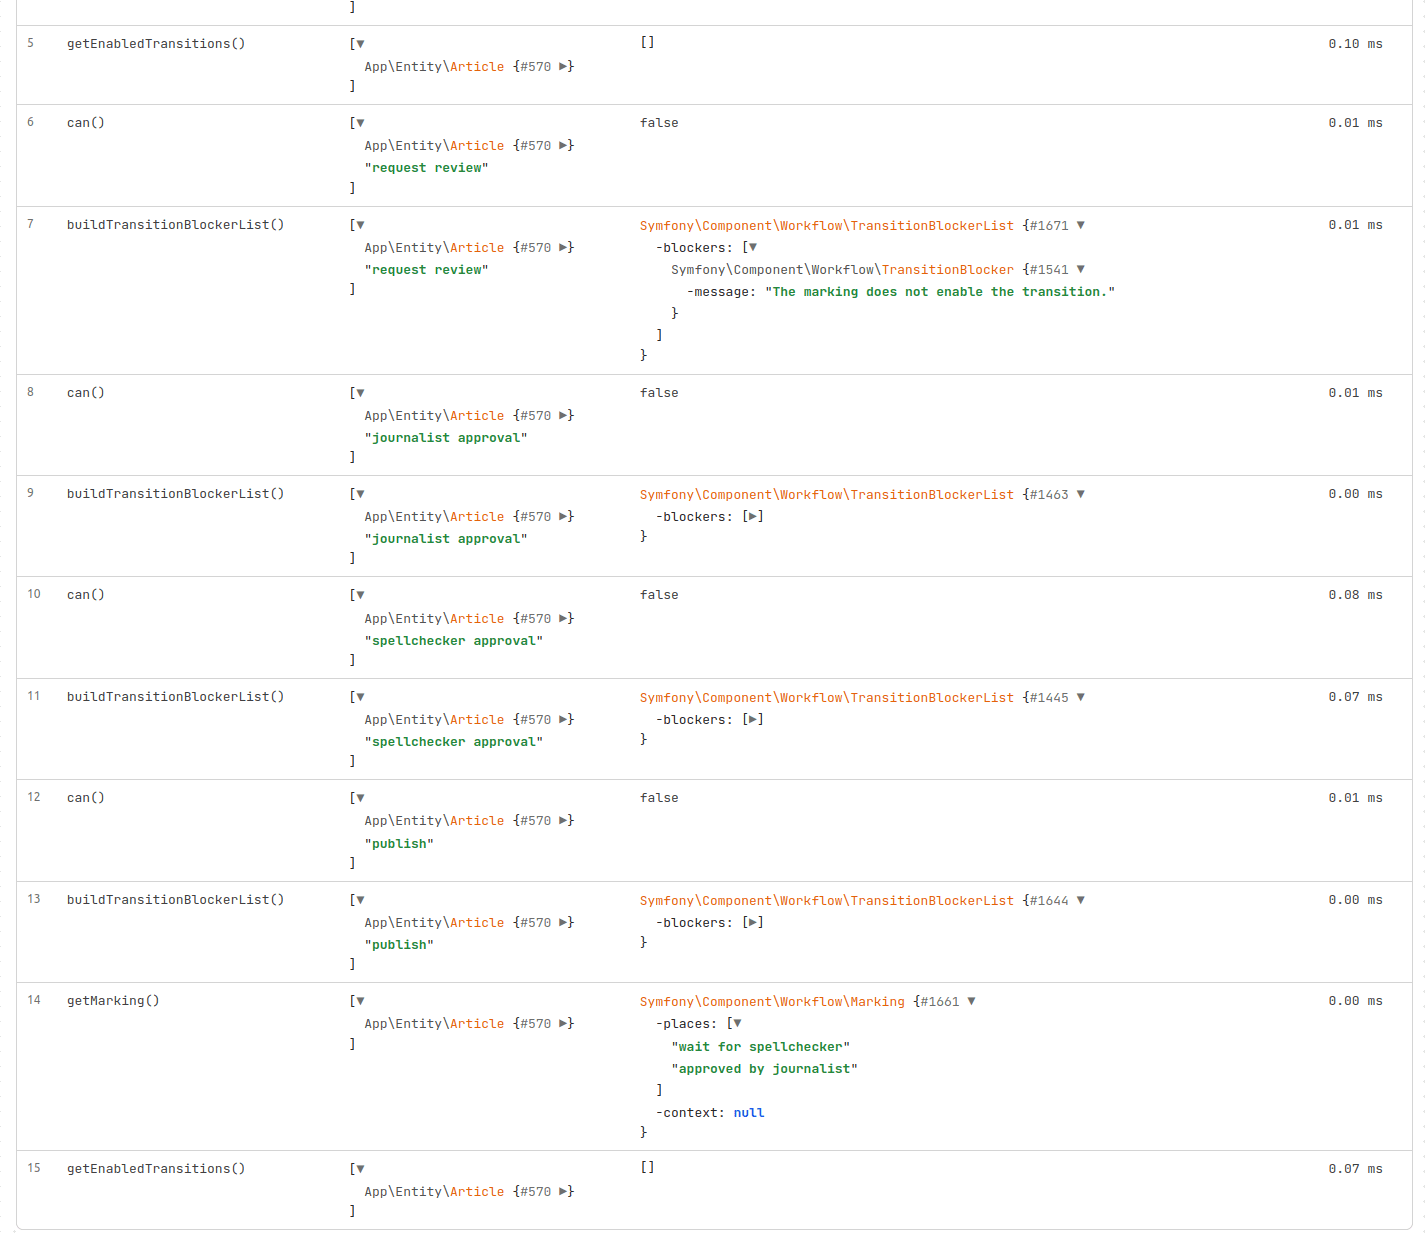
That's all. In the Symfony Profiler you'll now see a new section called Workflow which shows the graphic representation of your workflows. This will make it much easier to debug any issues with them:
Published in
#Living on the edge
Awesome, thank you @lyrixx!
Thank you ! I love the Workflow Component :D
Awesome / Шикарной! <3
Awesome
Wow! 🤩