During both the development and deployment phases, developers require a consistent stream of diagnostic information in order to determine whether the application is working as intended. This information is generally aggregated through logging and debugging utilities. Because of the central role frameworks, such as symfony, play in driving applications, it's crucial that such capabilities are tightly integrated to ensure efficient developmental and operational activities.
During the life of an application on the production server, the application administrator repeats a large number of tasks, from log rotation to upgrades. A framework must also provide tools to automate these tasks as much as possible.
This chapter explains how symfony application management tools can answer all these needs.
Logging
The only way to understand what went wrong during the execution of a request is to review a trace of the execution process. Fortunately, as you'll learn in this section, both PHP and symfony tend to log large amounts of this sort of data.
PHP Logs
PHP has an error_reporting parameter, defined in php.ini, that specifies which PHP events are logged. Symfony allows you to override this value, per application and environment, in the settings.yml file, as shown in Listing 16-1.
Listing 16-1 - Setting the Error Reporting Level, in frontend/config/settings.yml
prod:
 .settings:
    error_reporting:  <?php echo (E_PARSE | E_COMPILE_ERROR | E_ERROR | E_CORE_ERROR | E_USER_ERROR)."\n" ?>

dev:
  .settings:
    error_reporting:  <?php echo (E_ALL | E_STRICT)."\n" ?>
In order to avoid performance issues in the production environment, the server logs only the critical PHP errors. However, in the development environment, all types of events are logged, so that the developer can have all the information necessary to trace errors.
The location of the PHP log files depends on your php.ini configuration. If you never bothered about defining this location, PHP probably uses the logging facilities provided by your web server (such as the Apache error logs). In this case, you will find the PHP logs under the web server log directory.
Symfony Logs
In addition to the standard PHP logs, symfony can log a lot of custom events. You can find all the symfony logs under the myproject/log/ directory. There is one file per application and per environment. For instance, the development environment log file of the frontend application is named frontend_dev.log, the production one is named frontend_prod.log, and so on.
If you have a symfony application running, take a look at its log files. The syntax is very simple. For every event, one line is added to the log file of the application. Each line includes the exact time of the event, the nature of the event, the object being processed, and any additional relevant details. Listing 16-2 shows an example of symfony log file content.
Listing 16-2 - Sample Symfony Log File Content, in log/frontend_dev.log
Nov 15 16:30:25 symfony [info ] {sfAction} call "barActions->executemessages()"
Nov 15 16:30:25 symfony [info ] {sfPropelLogger} executeQuery: SELECT bd_message.ID...
Nov 15 16:30:25 symfony [info ] {sfView} set slot "leftbar" (bar/index)
Nov 15 16:30:25 symfony [info ] {sfView} set slot "messageblock" (bar/mes...
Nov 15 16:30:25 symfony [info ] {sfView} execute view for template "messa...
Nov 15 16:30:25 symfony [info ] {sfView} render "/home/production/myproject/...
Nov 15 16:30:25 symfony [info ] {sfView} render to client
You can find many details in these files, including the actual SQL queries sent to the database, the templates called, the chain of calls between objects, and so on.
note
The format of the file logs is configurable by overriding the format and/or the time_format settings in factories.yml as shown in Listing 16-3.
Listing 16-3 - Changing the Log Format
all:
  logger:
    param:
      sf_file_debug:
        param:
          format:      %time% %type% [%priority%] %message%%EOL%
          time_format: %b %d %H:%M:%S
Symfony Log Level Configuration
There are eight levels of symfony log messages: emerg, alert, crit, err, warning, notice, info, and debug, which are the same as the PEAR::Log package levels. You can configure the maximum level to be logged in each environment in the factories.yml configuration file of each application, as demonstrated in Listing 16-4.
Listing 16-4 - Default Logging Configuration, in frontend/config/factories.yml
prod:
  logger:
    param:
      level: err
By default, in all environments except the production environment, all the messages are logged (up to the least important level, the debug level). In the production environment, logging is disabled by default; if you change logging_enabled to true in settings.yml, only the most important messages (from crit to emerg) appear in the logs.
You can change the logging level in the factories.yml file for each environment to limit the type of logged messages.
tip
To see if logging is enabled, call sfConfig::get('sf_logging_enabled').
Adding a Log Message
You can manually add a message in the symfony log file from your code by using one of the techniques described in Listing 16-5.
Listing 16-5 - Adding a Custom Log Message
// From an action
$this->logMessage($message, $level);

// From a template
<?php use_helper('Debug') ?>

<?php log_message($message, $level) ?>
$level can have the same values as in the log messages.
Alternatively, to write a message in the log from anywhere in your application, use the sfLogger methods directly, as shown in Listing 16-6. The available methods bear the same names as the log levels.
Listing 16-6 - Adding a Custom Log Message from Anywhere
if (sfConfig::get('sf_logging_enabled'))
{
  sfContext::getInstance()->getLogger()->info($message);
}
Purging and Rotating Log Files
Don't forget to periodically purge the log/ directory of your applications, because these files have the strange habit of growing by several megabytes in a few days, depending, of course, on your traffic. Symfony provides a special log:clear task for this purpose, which you can launch regularly by hand or put in a cron table. For example, the following command erases the symfony log files:
$ php symfony log:clear
For both better performance and security, you probably want to store symfony logs in several small files instead of one single large file. The ideal storage strategy for log files is to back up and empty the main log file regularly, but to keep only a limited number of backups. You can enable such a log rotation with a period of 7 days and a history (number of backups) of 10, as shown in Listing 16-7. You would work with one active log file plus ten backup files containing seven days' worth of history each. Whenever the next period of seven days ends, the current active log file goes into backup, and the oldest backup is erased.
Listing 16-7 - Launching Log Rotation
$ php symfony log:rotate frontend prod --period=7 --history=10
The backup log files are stored in the logs/history/ directory and suffixed with the date they were saved.
Debugging
No matter how proficient a coder you are, you will eventually make mistakes, even if you use symfony. Detecting and understanding errors is one of the keys of fast application development. Fortunately, symfony provides several debug tools for the developer.
Symfony Debug Mode
Symfony has a debug mode that facilitates application development and debugging. When it is on, the following happens:
- The configuration is checked at each request, so a change in any of the configuration files has an immediate effect, without any need to clear the configuration cache.
- The error messages display the full stack trace in a clear and useful way, so that you can more efficiently find the faulty element.
- More debug tools are available (such as the detail of database queries).
- The Propel/Doctrine debug mode is also activated, so any error in a call to a Propel/Doctrine object will display a detailed chain of calls through the Propel/Doctrine architecture.
On the other hand, when the debug mode is off, processing is handled as follows:
- The YAML configuration files are parsed only once, then transformed into PHP files stored in the
cache/config/folder. Every request after the first one ignores the YAML files and uses the cached configuration instead. As a consequence, the processing of requests is much faster. - To allow a reprocessing of the configuration, you must manually clear the configuration cache.
- An error during the processing of the request returns a response with code 500 (Internal Server Error), without any explanation of the internal cause of the problem.
The debug mode is activated per application in the front controller. It is controlled by the value of the third argument passed to the getApplicationConfiguration() method call, as shown in Listing 16-8.
Listing 16-8 - Sample Front Controller with Debug Mode On, in web/frontend_dev.php
<?php

require_once(dirname(__FILE__).'/../config/ProjectConfiguration.class.php');

$configuration = ProjectConfiguration::getApplicationConfiguration('frontend', 'dev', true);
sfContext::createInstance($configuration)->dispatch();
caution
In your production server, you should not activate the debug mode nor leave any front controller with debug mode on available. Not only will the debug mode slow down the page delivery, but it may also reveal the internals of your application. Even though the debug tools never reveal database connection information, the stack trace of exceptions is full of dangerous information for any ill-intentioned visitor.
Symfony Exceptions
When an exception occurs in the debug mode, symfony displays a useful exception notice that contains everything you need to find the cause of the problem.
The exception messages are clearly written and refer to the most probable cause of the problem. They often provide possible solutions to fix the problem, and for most common problems, the exception pages even contain a link to a symfony website page with more details about the exception. The exception page shows where the error occurred in the PHP code (with syntax highlighting), together with the full stack of method calls, as shown in Figure 16-1. You can follow the trace to the first call that caused the problem. The arguments that were passed to the methods are also shown.
note
Symfony really relies on PHP exceptions for error reporting. For instance, the 404 error can be triggered by an sfError404Exception.
Figure 16-1 - Sample exception message for a symfony application
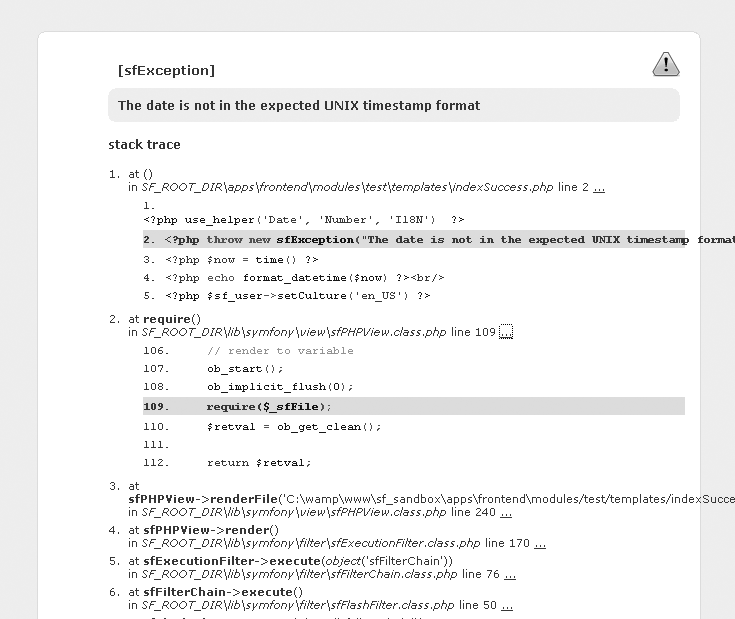
During the development phase, the symfony exceptions will be of great use as you debug your application.
Xdebug Extension
The Xdebug PHP extension allows you to extend the amount of information that is logged by the web server. Symfony integrates the Xdebug messages in its own debug feedback, so it is a good idea to activate this extension when you debug the application. The extension installation depends very much on your platform; refer to the Xdebug website for detailed installation guidelines. Once Xdebug is installed, you need to activate it manually in your php.ini file after installation. For *nix platforms, this is done by adding the following line:
zend_extension="/usr/local/lib/php/extensions/no-debug-non-zts-20041030/xdebug.so"
For Windows platforms, the Xdebug activation is triggered by this line:
extension=php_xdebug.dll
Listing 16-9 gives an example of Xdebug configuration, which must also be added to the php.ini file.
Listing 16-9 - Sample Xdebug Configuration
;xdebug.profiler_enable=1
;xdebug.profiler_output_dir="/tmp/xdebug"
xdebug.auto_trace=1             ; enable tracing
xdebug.trace_format=0
;xdebug.show_mem_delta=0        ; memory difference
;xdebug.show_local_vars=1
;xdebug.max_nesting_level=100
You must restart your web server for the Xdebug mode to be activated.
caution
Don't forget to deactivate Xdebug mode in your production platform. Not doing so will slow down the execution of every page a lot.
Web Debug Toolbar
The log files contain interesting information, but they are not very easy to read. The most basic task, which is to find the lines logged for a particular request, can be quite tricky if you have several users simultaneously using an application and a long history of events. That's when you start to need a web debug toolbar.
This toolbar appears as a semitransparent box superimposed over the normal content in the browser, in the top-right corner of the window, as shown in Figure 16-2. It gives access to the symfony log events, the current configuration, the properties of the request and response objects, the details of the database queries issued by the request, and a chart of processing times related to the request.
Figure 16-2 - The web debug toolbar appears in the top-right corner of the window

The color of the debug toolbar background depends on the highest level of log message issued during the request. If no message passes the debug level, the toolbar has a gray background. If a single message reaches the err level, the toolbar has a red background.
note
Don't confuse the debug mode with the web debug toolbar. The debug toolbar can be displayed even when the debug mode if off, although, in that case, it displays much less information.
To activate the web debug toolbar for an application, open the settings.yml file and look for the web_debug key. In the prod and test environments, the default value for web_debug is false, so you need to activate it manually if you want it. In the dev environment, the default configuration has it set to true, as shown in Listing 16-10.
Listing 16-10 - Web Debug Toolbar Activation, in frontend/config/settings.yml
dev:
  .settings:
    web_debug: true
When displayed, the web debug toolbar offers a lot of information/interaction:
- Click the symfony logo to toggle the visibility of the toolbar. When reduced, the toolbar doesn't hide the elements located at the top of the page.
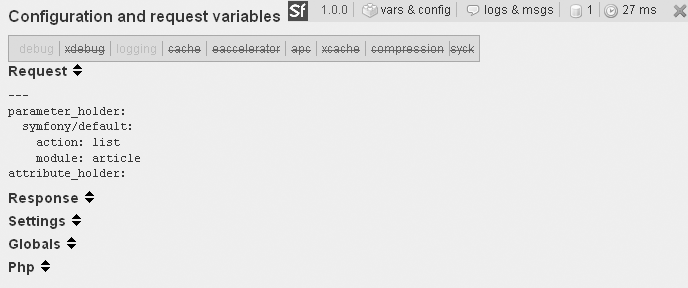
- Click the "config" section to show the details of the request, response, settings, globals, and PHP properties, as shown in Figure 16-3. The top line sums up the important configuration settings, such as the debug mode, the cache, and the presence of a PHP accelerator (they appear in red if they are deactivated and in green if they are activated).
Figure 16-3 - The "config" section shows all the variables and constants of the request
- When the cache is enabled, a green arrow appears in the toolbar. Click this arrow to reprocess the page, regardless of what is stored in the cache (but the cache is not cleared).
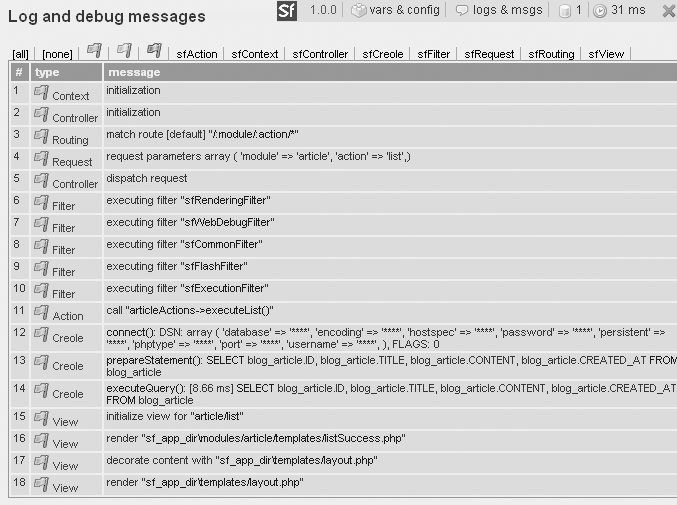
- Click the "logs" section to reveal the log messages for the current request, as shown in Figure 16-4. According to the importance of the events, they are displayed in gray, yellow, or red lines. You can filter the events that are displayed by category using the links displayed at the top of the list.
Figure 16-4 - The "logs" section shows the log messages for the current request
note
When the current action results from a redirect, only the logs of the latest request are present in the "logs" pane, so the log files are still indispensable for good debugging.
- For requests executing SQL queries, a database icon appears in the toolbar. Click it to see the detail of the queries, as shown in Figure 16-5.
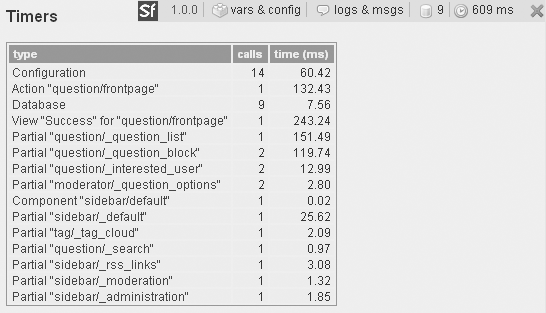
- To the right of a clock icon is the total time necessary to process the request. Be aware that the web debug toolbar and the debug mode slow down the request execution, so try to refrain from considering the timings per se, and pay attention to only the differences between the execution time of two pages. Click the clock icon to see details of the processing time category by category, as shown in Figure 16-6. Symfony displays the time spent on specific parts of the request processing. Only the times related to the current request make sense for an optimization, so the time spent in the symfony core is not displayed. That's why these times don't sum up to the total time.
- Click the red x at the right end of the toolbar to hide the toolbar.
Figure 16-5 - The database queries section shows queries executed for the current request
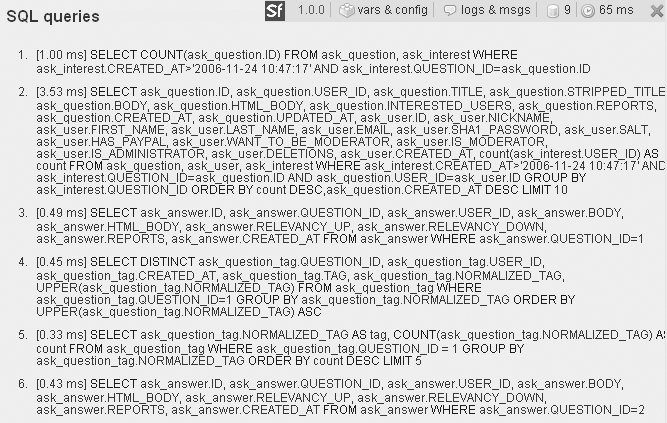
Figure 16-6 - The clock icon shows execution time by category
note
The web debug toolbar is not included by default in Ajax responses and documents that have a non-HTML content-type. For the other pages, you can disable the web debug toolbar manually from within an action by simply calling sfConfig::set('sf_web_debug', false).
Manual Debugging
Getting access to the framework debug messages is nice, but being able to log your own messages is better. Symfony provides shortcuts, accessible from both actions and templates, to help you trace events and/or values during request execution.
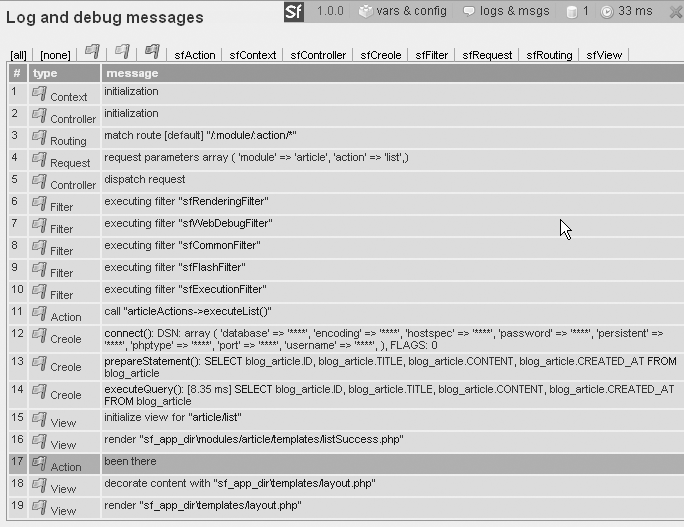
Your custom log messages appear in the symfony log file as well as in the web debug toolbar, just like regular events. (Listing 16-5 gave an example of the custom log message syntax.) A custom message is a good way to check the value of a variable from a template, for instance. Listing 16-11 shows how to use the web debug toolbar for developer's feedback from a template (you can also use $this->logMessage() from an action).
Listing 16-11 - Inserting a Message in the Log for Debugging Purposes
<?php use_helper('Debug') ?>
...
<?php if ($problem): ?>
  <?php log_message('{sfAction} been there', 'err') ?>
  ...
<?php endif ?>
The use of the err level guarantees that the event will be clearly visible in the list of messages, as shown in Figure 16-7.
Figure 16-7 - A custom log message appears in the "logs" section of the web debug toolbar
Using symfony outside of a web context
You may want to execute a script from the command line (or via a cron table) with access to all the symfony classes and features, for instance to launch batch e-mail jobs or to periodically update your model through a process-intensive calculation. The simple way of doing this is to create a PHP script that reproduces the first steps of a front controller, so that symfony is properly initialized. You can also use the symfony command line system, to take advantage of arguments parsing and automated database initialization.
Batch Files
Initializing symfony just takes a couple lines of PHP code. You can take advantage of all symfony features by creating a PHP file, for instance under the lib/ directory of your project, starting with the lines shown in Listing 16-12.
Listing 16-12 - Sample Batch Script, in lib/myScript.php
<?php

require_once(dirname(__FILE__).'/../config/ProjectConfiguration.class.php');
$configuration = ProjectConfiguration::getApplicationConfiguration('frontend', 'dev', true);

// Remove the following lines if you don't use the database layer
$databaseManager = new sfDatabaseManager($configuration);

// add code here
This strongly looks like the first lines of a front controller (see Chapter 6), because these lines do the same: initialize symfony, parse a project and an application configuration. Note that the ProjectConfiguration::getApplicationConfiguration method expects three parameters:
- an application name
- an environment name
- a Boolean, defining if the debug features should be enabled or not
To execute your code, just call the script from the command line:
$ php lib/myScript.php
Custom Tasks
An alternative way of creating custom command line scripts using symfony is to write a symfony task. Just like the cache:clear and the propel:build-model tasks, you can launch your own custom tasks from the command line with php symfony. Custom tasks benefit from the ability to parse command line arguments and options, can embed their own help text, and can extend existing tasks.
A custom task is just a class extending sfBaseTask and located under a lib/task/ directory, either under the project root, or in a plugin directory. Its file name must end with 'Task.class.php'. Listing 16-13 shows a sample custom task.
Listing 16-13 - Sample Task, in lib/task/testHelloTask.class.php
<?php

class testHelloTask extends sfBaseTask
{
  protected function configure()
  {
    $this->namespace = 'test';
    $this->name = 'hello';
    $this->briefDescription = 'Says hello';
  }

  protected function execute($arguments = array(), $options = array())
  {
    // your code here
    $this->log('Hello, world!');
  }
}
The code written in the execute method has access to all the symfony libraries, just like in the previous batch script. The difference is how you call the custom task:
$ php symfony test:hello
The task name comes from the protected namespace and name properties (not from the class name, nor from the file name). And since your task is integrated into the symfony command line, it appears in the task list when you just type:
$ php symfony
Rather than writing a task skeleton by yourself, you can use the symfony generate:task task. It creates an empty task, and has plenty of customization options. Make sure you check them by calling:
$ php symfony help generate:task
Tasks can accept arguments (compulsory parameters, in a predefined order) and options (optional and unordered parameters). Listing 16-14 shows a more complete task, taking advantage of all these features.
Listing 16-14 - More Complete Sample Task, in lib/task/mySecondTask.class.php
class mySecondTask extends sfBaseTask
{
  protected function configure()
  {
    $this->namespace        = 'foo';
    $this->name             = 'mySecondTask';
    $this->briefDescription = 'Does some neat things, with style';
    $this->detailedDescription = <<<EOF
The [foo:mySecondTask|INFO] task manages the process of achieving things for you.
Call it with:

  [php symfony foo:mySecondTask frontend|INFO]

You can enable verbose output by using the [verbose|COMMENT] option:

  [php symfony foo:mySecondTask frontend --verbose=on|INFO]
EOF;
    $this->addArgument('application', sfCommandArgument::REQUIRED, 'The application name');
    $this->addOption('verbose', null, sfCommandOption::PARAMETER_REQUIRED, 'Enables verbose output', false);
  }

  protected function execute($arguments = array(), $options = array())
  {
    // add code here

  }
}
note
If your task needs access to the database layer through the , it should extend sfPropelBaseTask instead of sfBaseTask. The task initialization will then take care of loading the additional Propel classes. You can start a database connection in the execute() method by calling:
$databaseManager = new sfDatabaseManager($this->configuration);
If the task configuration defines an application and an env argument, they are automatically considered when building the task configuration, so that a task can use any of the database connections defined in your databases.yml. By default, skeletons generated by a call to generate:task include this initialization.
For more examples on the abilities of the task system, check the source of existing symfony tasks.
Populating a Database
In the process of application development, developers are often faced with the problem of database population. A few specific solutions exist for some database systems, but none can be used on top of the object-relational mapping. Thanks to YAML and the sfPropelData object, symfony can automatically transfer data from a text source to a database. Although writing a text file source for data may seem like more work than entering the records by hand using a CRUD interface, it will save you time in the long run. You will find this feature very useful for automatically storing and populating the test data for your application.
Fixture File Syntax
Symfony can read data files that follow a very simple YAML syntax, provided that they are located under the data/fixtures/ directory. Fixture files are organized by class, each class section being introduced by the class name as a header. For each class, records labeled with a unique string are defined by a set of fieldname: value pairs. Listing 16-15 shows an example of a data file for database population.
Listing 16-15 - Sample Fixture File, in data/fixtures/import_data.yml
Article:                             ## Insert records in the blog_article table
  first_post:                        ## First record label
    title:       My first memories
    content: |
      For a long time I used to go to bed early. Sometimes, when I had put
      out my candle, my eyes would close so quickly that I had not even time
      to say "I'm going to sleep".

  second_post:                       ## Second record label
    title:       Things got worse
    content: |
      Sometimes he hoped that she would die, painlessly, in some accident,
      she who was out of doors in the streets, crossing busy thoroughfares,
      from morning to night.
Symfony translates the column keys into setter methods by using a camelCase converter (setTitle(), setContent()). This means that you can define a password key even if the actual table doesn't have a password field--just define a setPassword() method in the User object, and you can populate other columns based on the password (for instance, a hashed version of the password).
The primary key column doesn't need to be defined. Since it is an auto-increment field, the database layer knows how to determine it.
The created_at columns don't need to be set either, because symfony knows that fields named that way must be set to the current system time when created.
Launching the Import
The propel:data-load task imports data from YAML files to a database. The connection settings come from the databases.yml file, and therefore need an application name to run. Optionally, you can specify an environment name by adding a --env option (dev by default).
$ php symfony propel:data-load --env=prod --application=frontend
This command reads all the YAML fixture files from the data/fixtures/ directory and inserts the records into the database. By default, it replaces the existing database content, but if you add an --append option, the command will not erase the current data.
$ php symfony propel:data-load --append --application=frontend
You can specify another fixture directory in the call. In this case, add a path relative to the project directory.
$ php symfony propel:data-load --application=frontend data/myfixtures
Using Linked Tables
You now know how to add records to a single table, but how do you add records with foreign keys to another table? Since the primary key is not included in the fixtures data, you need an alternative way to relate records to one another.
Let's return to the example in Chapter 8, where a blog_article table is linked to a blog_comment table, as shown in Figure 16-8.
Figure 16-8 - A sample database relational model

This is where the labels given to the records become really useful. To add a Comment field to the first_post article, you simply need to append the lines shown in Listing 16-16 to the import_data.yml data file.
Listing 16-16 - Adding a Record to a Related Table, in data/fixtures/import_data.yml
Comment:
  first_comment:
    article_id:   first_post
    author:       Anonymous
    content:      Your prose is too verbose. Write shorter sentences.
The propel:data-load task will recognize the label that you gave to an article previously in import_data.yml, and grab the primary key of the corresponding Article record to set the article_id field. You don't even see the IDs of the records; you just link them by their labels--it couldn't be simpler.
The only constraint for linked records is that the objects called in a foreign key must be defined earlier in the file; that is, as you would do if you defined them one by one. The data files are parsed from the top to the bottom, and the order in which the records are written is important.
This also works for many-to-many relationships, where two classes are related through a third class. For instance, an Article can have many Authors, and an Author can have many Articles. You usually use an ArticleAuthor class for that, corresponding to an article_author table with an article_id and an author_id columns. Listing 16-17 shows how to write a fixture file to define many-to-many relationships with this model. Notice the plural table name used here--this is what triggers the search for a middle class.
Listing 16-17 - Adding a Record to a Table Related by a Many-to-Many relationship, in data/fixtures/import_data.yml
Author:
  first_author:
    name: John Doe
    article_authors: [first_post, second_post]
One data file can contain declarations of several classes. But if you need to insert a lot of data for many different tables, your fixture file might get too long to be easily manipulated.
The propel:data-load task parses all the files it finds in the fixtures/ directory, so nothing prevents you from splitting a YAML fixture file into smaller pieces. The important thing to keep in mind is that foreign keys impose a processing order for the tables. To make sure that they are parsed in the correct order, prefix the files with an ordinal number.
100_article_import_data.yml
200_comment_import_data.yml
300_rating_import_data.yml
note
Doctrine does not need specific file names as it automatically takes care of executing the SQL statements in the right order.
Deploying Applications
Symfony offers shorthand commands to synchronize two versions of a website. These commands are mostly used to deploy a website from a development server to a final host, connected to the Internet.
Using rsync for Incremental File Transfer
Sending the root project directory by FTP is fine for the first transfer, but when you need to upload an update of your application, where only a few files have changed, FTP is not ideal. You need to either transfer the whole project again, which is a waste of time and bandwidth, or browse to the directories where you know that some files changed, and transfer only the ones with different modification dates. That's a time-consuming job, and it is prone to error. In addition, the website can be unavailable or buggy during the time of the transfer.
The solution that is supported by symfony is rsync synchronization through an SSH layer. Rsync is a command-line utility that provides fast incremental file transfer, and it's open source. With incremental transfer, only the modified data will be sent. If a file didn't change, it won't be sent to the host. If a file changed only partially, just the differential will be sent. The major advantage is that rsync synchronizations transfer only a small amount of data and are very fast.
Symfony adds SSH on top of rsync to secure the data transfer. More and more commercial hosts support an SSH tunnel to secure file uploads on their servers, and that's a good practice to avoid security breaches.
The SSH client called by symfony uses connection settings from the config/properties.ini file. Listing 16-18 gives an example of connection settings for a production server. Write the settings of your own production server in this file before any synchronization. You can also define a single parameters setting to provide your own rsync command line parameters.
Listing 16-18 - Sample Connection Settings for a Server Synchronization, in myproject/config/properties.ini
name=myproject

[production]
  host=myapp.example.com
  port=22
  user=myuser
  dir=/home/myaccount/myproject/
note
Don't confuse the production server (the host server, as defined in the properties.ini file of the project) with the production environment (the front controller and configuration used in production, as referred to in the configuration files of an application).
Doing an rsync over SSH requires several commands, and synchronization can occur a lot of times in the life of an application. Fortunately, symfony automates this process with just one command:
$ php symfony project:deploy production
This command launches the rsync command in dry mode; that is, it shows which files must be synchronized but doesn't actually synchronize them. If you want the synchronization to be done, you need to request it explicitly by adding the --go option.
$ php symfony project:deploy production --go
Don't forget to clear the cache in the production server after synchronization.
tip
Before deploying your application to the production servers, it is better to first check your configuration with the check_configuration.php. This utility can be found in the data/bin folder of symfony. It checks your environment against symfony requirements. You can launch it from anywhere:
$ php /path/to/symfony/data/bin/check_configuration.php
Even if you can use this utility from the command line, it's strongly recommended to launch it from the web by copying it under your web root directory as PHP can use different php.ini configuration files for the command line interface and the web.
Ignoring Irrelevant Files
If you synchronize your symfony project with a production host, a few files and directories should not be transferred:
- All the version control directories (
.svn/,CVS/, and so on) and their content are necessary only for development and integration. - The front controller for the development environment must not be available to the final users. The debugging and logging tools available when using the application through this front controller slow down the application and give information about the core variables of your actions. It is something to keep away from the public.
- The
cache/andlog/directories of a project must not be erased in the host server each time you do a synchronization. These directories must be ignored as well. If you have astats/directory, it should probably be treated the same way. - The files uploaded by users should not be transferred. One of the good practices of symfony projects is to store the uploaded files in the
web/uploads/directory. This allows you to exclude all these files from the synchronization by pointing to only one directory.
To exclude files from rsync synchronizations, open and edit the rsync_exclude.txt file under the myproject/config/ directory. Each line can contain a file, a directory, or a pattern. The symfony file structure is organized logically, and designed to minimize the number of files or directories to exclude manually from the synchronization. See Listing 16-19 for an example.
Listing 16-19 - Sample rsync Exclusion Settings, in myproject/config/rsync_exclude.txt
# Project files
/cache/*
/log/*
/web/*_dev.php
/web/uploads/*

# SCM files
.arch-params
.bzr
_darcs
.git
.hg
.monotone
.svn
CVS
note
The cache/ and log/ directories must not be synchronized with the development server, but they must at least exist in the production server. Create them by hand if the myproject/ project tree structure doesn't contain them.
Managing a Production Application
The command that is used most often in production servers is cache:clear. You must run it every time you upgrade symfony or your project (for instance, after calling the project:deploy task), and every time you change the configuration in production.
$ php symfony cache:clear
tip
If the command-line interface is not available in your production server, you can still clear the cache manually by erasing the contents of the cache/ folder.
You can temporarily disable your application--for instance, when you need to upgrade a library or a large amount of data.
$ php symfony project:disable APPLICATION_NAME ENVIRONMENT_NAME
By default, a disabled application displays the sfConfig::get('sf_symfony_lib_dir')/exception/data/unavailable.php page, but if you create your own unavailable.php file in your project's config/ directory, symfony will use it instead.
The project:enable task reenables the application and clears the cache.
$ php symfony project:enable APPLICATION_NAME ENVIRONMENT_NAME
caution
project:disable currently has no effect if the check_lock parameter is not
set to true in settings.yml.
Summary
By combining PHP logs and symfony logs, you can monitor and debug your application easily. During development, the debug mode, the exceptions, and the web debug toolbar help you locate problems. You can even insert custom messages in the log files or in the toolbar for easier debugging.
The command-line interface provides a large number of tools that facilitate the management of your applications, during development and production phases. Among others, the data population, and synchronization tasks are great time-savers.
This work is licensed under the GFDL license.